. 2005 May;16(5):2285-300.
doi: 10.1091/mbc.e04-11-0987. Epub 2005 Feb 23.

Specialization of the HOG pathway and its impact on differentiation and virulence of Cryptococcus neoformans

Affiliations

Specialization of the HOG pathway and its impact on differentiation and virulence of Cryptococcus neoformans

Yong-Sun Bahn et al. Mol Biol Cell. 2005 May.

Abstract

The human pathogenic fungus Cryptococcus neoformans has diverged from a common ancestor into three biologically distinct varieties or sibling species over the past 10-40 million years. During evolution of these divergent forms, serotype A C. neoformans var. grubii has emerged as the most virulent and cosmopolitan pathogenic clade. Therefore, understanding how serotype A C. neoformans is distinguished from less successful pathogenic serotypes will provide insights into the evolution of fungal virulence. Here we report that the structurally conserved Pbs2-Hog1 MAP kinase cascade has been specifically recruited as a global regulator to control morphological differentiation and virulence factors in the highly virulent serotype A H99 clinical isolate, but not in the laboratory-generated and less virulent serotype D strain JEC21. The mechanisms of Hog1 regulation are strikingly different between the two strains, and the phosphorylation kinetics and localization pattern of Hog1 are opposite in H99 compared with JEC21 and other yeasts. The unique Hog1 regulatory pattern observed in the H99 clinical isolate is widespread in serotype A strains and is also present in some clinical serotype D isolates. Serotype A hog1delta and pbs2delta mutants are attenuated in virulence, further underscoring the role of the Pbs2-Hog1 MAPK cascade in the pathogenesis of cryptococcosis.


Figures

Figure 1.
Figure 1.
Expression of the C. neoformans HOG1 gene complements the osmosensitive phenotypes of a S. cerevisiae hog1Δ mutant. The wild-type S. cerevisiae diploid strain BY4743 and the homozygous hog1Δ/hog1Δ mutant bearing the control plasmid pTH19 (WT or Schog1Δ+vector only) or plasmid pADH-HOG1 expressing C. neoformans HOG1 from the ADH1 promoter (WT or Schog1Δ+CnHOG1) were grown overnight at 30°C in SD medium uracil, serially diluted (1–104 dilutions), spotted onto solid SD medium containing 1 M NaCl or KCl, incubated at 30°C for 2 d, and photographed.
Figure 2.
Figure 2.
Hog1 plays shared and distinct roles in diverse stress responses in divergent C. neoformans serotypes. Each C. neoformans strain (serotype A WT [H99], hog1Δ [YSB64], and hog1Δ+HOG1 reconstituted [YSB145] strains; serotype D wild-type [JEC21], hog1Δ [YSB139] and hog1Δ+HOG1 reconstituted [YSB203] strains) was grown to midlogarithmic phase in YPD medium, 10-fold serially diluted (1–104 dilutions), and 2 μl of each diluted cell suspension was spotted on YPD medium containing 1 or 1.5 M KCl for hyper-osmotic shock, or 2 or 3 mM H2O2 for oxidative stress. To test temperature and UV sensitivity, cells on solid medium were incubated at 30, 37, and 40°C, and exposed to UV for 0.2 (480 J/m2) and 0.3 min (720 J/m2), respectively. Cells were further incubated for 2 d and photographed.
Figure 3.
Figure 3.
Hog1 represses melanin and capsule production by counteracting the cAMP-PKA pathway in serotype A, but not in serotype D. (A and B) Capsule production by the serotype A (WT [H99], hog1Δ [YSB64], hog1Δ+HOG1 [YSB145], hog1Δ gpa1Δ [YSB152], hog1Δ cac1Δ [YSB155], and hog1Δ pka1Δ [YSB112]) strains and by the serotype D (WT [JEC21], hog1Δ [YSB139], and hog1Δ+HOG1 [YSB203]) strains grown at 37°C on solid DME medium for 24 h was visualized by India ink staining and relative capsule size (%) was determined. Asterisk indicates the serotype A hog1Δ strain, which has a significantly larger capsule size (p < 0.05) than the WT. Bar, 10 μm. (C) The same isogenic strain series in A and B and the serotype D hog1Δ pka2Δ (YSB231) strain were grown at 30°C (serotype D) or 37°C (serotype A) on Niger seed medium to induce melanin production for 2 d (0.1% glucose) or 4 d (2% glucose) and photographed.
Figure 4.
Figure 4.
Hog1 represses pheromone MAPK cascade activated mating in serotype A, but not in serotype D. (A) The following MATα and MATa strains were cocultured on V8 medium (pH 5.0 for serotype A and pH 7.0 for serotype D) for 1 wk at room temperature in the dark: for serotype A, H99 and KN99a (α×a), YSB64 and YSB81 (hog1×hog1), and YSB145 and YSB148 (hog1+HOG1×hog1+HOG1), and for serotype D, JEC21 and JEC20 (α×a), YSB139 and YSB143 (hog1×hog1), YSB203 and YSB206 (hog1+HOG1×hog1+HOG1). Representative edges of the mating patches were photographed at ×100 magnification after 2 or 7 d incubation. (B) The serotype A MATa WT (KN99a, the first and third columns) and hog1Δ (YSB81, the second and fourth columns) strains were cocultured for 2 wk on V8 medium with the MATα gpa1Δ (YSB83), cac1Δ (YSB42), pka1Δ (JKH7), ras1Δ (YSB51), and gpb1Δ (YSB49) strains and photographed.
Figure 5.
Figure 5.
Mutation of the serotype A HOG1 gene increases mating pheromone production. (A) The MATα WT (H99) and crg1Δ (H99 crg1) strains were confronted with the MATa WT (KN99a), crg1Δ (PPW196), and hog1Δ (YSB81) strains, incubated for 7 d at room temperature in the dark, and photographed at ×40 magnification. (B) Northern blot analysis was performed with total RNA isolated from solo- or cocultures of the indicated strain(s) grown for 24 h under mating conditions: for sero-type A, WTα (H99), WTa (KN99a), hog1α (YSB64), and hog1a (YSB81); for serotype D, WTα (JEC21), WTa (JEC20), hog1α (YSB139), and hog1a (YSB143). The blot was probed with the MFα1 gene and subsequently probed with an ACT1 probe as a loading control. The bar graph demonstrates the quantitative measurement of MFα1 induction by phosphorimager analysis. The fold induction in the Y-axis indicates relative MFα1 expression levels of each culture(s) normalized to ACT1 expression levels and compared with WTα.
Figure 6.
Figure 6.
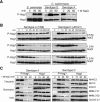
Hog1 exhibits opposite phosphorylation patterns in serotype A compared with serotype D and S. cerevisiae. (A) C. neoformans serotype A (H99), serotype D (JEC21), and S. cerevisiae (Σ strain) strains were grown to midlogarithmic phase and exposed to 1 M NaCl in YPD medium for the time indicated and total protein extracts were prepared for Western blot analysis. The dual phosphorylation status of Hog1 (T171 and Y173) was monitored using antidually phosphorylated p38 antibody (P-Hog1). The same blots were stripped and then probed with polyclonal anti-Hog1 antibody for the Hog1 loading control (Hog1). (B) The Hog1 phosphorylation patterns in serotype A (H99) and D (JEC21) were monitored for a longer time course in different NaCl concentrations (0.5, 1, and 1.5 NaCl) as described in A. (C) The Hog1 phosphorylation patterns in various clinical and environmental serotype A and D isolates were monitored during osmotic shock (1 M NaCl) as described A. For serotype A, six clinical strains isolated from Tanzania (78.7.98 [first row] and 46F.5.02 [second row]), Botswana (BT63 [third row] and BT130 [fourth row]), Asia (S25C [fifth row] and S25J [sixth row]) were used. For serotype D, B3501, NIH12, NIH433, MMRL757, MMRL760, and CDC92–27 strains were tested. NIH12 and NIH433 are parental clinical and environmental strains, respectively, for B3501 and JEC21. MMRL757 and MMRL760 are clinical serotype D strains isolated from HIV patients in Italy.
Figure 8.
Figure 8.
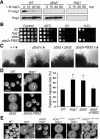
Dual phosphorylation mediated by the MAPKK Pbs2 is required for Hog1 function. (A) Hog1 dual phosphorylation was monitored by Western blot analysis in the serotype A WT (H99), pbs2Δ mutant (YSB123), and hog1Δ mutant (YSB64) grown in YPD medium containing 1.0 M NaCl for the indicated times. (B) Multistress responses of the pbs2Δ mutant (YSB123) and pbs2Δ+PBS2 reconstituted strain (YSB212) were compared with those of the WT (H99) and hog1Δ mutant (YSB64) as described in Figure 2 (UV [720 J/m2] and H2O2 [3 mM]). (C) The MATα WT, pbs2Δ, and pbs2Δ+PBS2 strains were cocultured for 7 d with the MATa WT (KN99a) or pbs2Δ (YSB125) mutant strains under mating conditions and photographed at ×100 magnification as described in Figure 4. (D) Capsule production of the pbs2Δ and pbs2Δ+PBS2 strains was visualized and quantitatively measured as described in Figure 3 and compared with the WT and hog1Δ mutant strains. Asterisks represent significant increases in the capsule size of the hog1Δ and pbs2Δ mutants relative to the WT. Bar, 10 μm. (E) Capsule production of the WT (H99), hog1Δ (YSB64), hog1Δ+HOG1 (YSB145), hog1Δ+HOG1T171A (YSB250), hog1Δ+HOG1Y173A (YSB252), and hog1Δ+HOG1T171A+Y173A (YSB253) strains was visualized with India ink and photographed. Bar, 10 μm.
Figure 7.
Figure 7.
Subcellular localization of Hog1 in serotype A and D C. neoformans corresponds to the Hog1 phosphorylation status. (A) Western blot analysis was performed as described in Figure 6 with protein extracts isolated from serotype A and D wild-type strains (H99 and JEC21) and hog1Δ mutants containing pACT-HOG1fGFP (constitutive expression of Hog1 (serotype A)-GFP fusion protein from the ACT1 promoter), YSB242 and YSB243. (B) To determine the subcellular localization of Hog1 in serotype A and D, YSB242 and YSB243 were exposed to 1 M NaCl for the indicated incubation times, fixed, and permeabilized to monitor GFP signals and DAPI staining. Bar, 10 μm.
Figure 9.
Figure 9.
Hog1 catalytic activity is required for Hog1 function and osmostress-induced dephosphorylation in serotype A. (A) Multistress responses of the serotype A (WT [H99], hog1A [YSB64], hog1A+HOG1 [YSB145], and hog1A+HOG1KD [YSB308, the K49S+K50N Hog1 kinase-dead mutant]) and serotype D (WT [JEC21], hog1D [YSB139], hog1D+HOG1 [YSB203], and hog1D+HOG1KD [YSB311]) strains were assessed as described in Figure 2. (B) Capsule production of each serotype A strain in A was visualized with India ink and photographed. Bar, 10 μm. (C) The phosphorylation kinetics of the hog1+HOG1KD mutants (YSB308 and YSB311) was monitored during osmotic shock (1 M NaCl) as described in Figure 6 and compared with those in the WT (H99 and JEC21) strains.
Figure 10.
Figure 10.
The Hog1 MAPK and Pbs2 MAPKK promote virulence of C. neoformans. A/Jcr mice were infected with 105 cells of MATα WT (▪: H99), hog1Δ (□: YSB64), hog1Δ+HOG1 reconstituted (▪: YSB145), pbs2Δ (×: YSB123), and pbs2Δ+PBS2 reconstituted strains (○: YSB212) by intranasal inhalation. Percent survival (%) was monitored for 33 d postinfection. Both hog1Δ and pbs2Δ mutants are significantly less virulent than the WT and their reconstituted strains (p < 0.001) and the pbs2Δ mutant is less virulent than the hog1Δ mutant (p < 0.003).
Figure 11.
Figure 11.
Proposed model for differential regulation of the HOG pathway in C. neoformans. In the serotype D strain JEC21, in response to osmotic shock, Hog1 MAPK is rapidly phosphorylated by Pbs2 MAPKK and then translocates to the nucleus to adapt to osmotic changes in a manner equivalent to that observed in budding yeast. In contrast, the HOG pathway is specially adapted to control differentiation and virulence factors as well as osmotic stress in serotype A strains including H99. In this model, Hog1 is constitutively phosphorylated by Pbs2 under normal conditions either by weak upstream activation or lack of pathway repression. After osmotic shock, phosphorylation-primed Hog1 is more rapidly activated than the unphosphorylated form, activates phosphotyrosine (Ptp) or phosphoserine/threonine (Ptc) phosphatase(s) through its catalytic activity, resulting in rapid Hog1 dephosphorylation. Under normal conditions, the constitutively phosphorylated form of Hog1 represses the pheromone-MAPK and cAMP-signaling pathways, indicating that the functions of the HOG pathway are uniquely specialized to control virulence factor production in serotype A and clinical serotype D strains.

References

    1. Alepuz, P. M., Jovanovic, A., Reiser, V., and Ammerer, G. (2001). Stress-induced map kinase Hog1 is part of transcription activation complexes. Mol. Cell 7, 767–777. - PubMed
    1. Alonso-Monge, R., Navarro-Garcia, F., Roman, E., Negredo, A. I., Eisman, B., Nombela, C., and Pla, J. (2003). The Hog1 mitogen-activated protein kinase is essential in the oxidative stress response and chlamydospore formation in Candida albicans. Eukaryot. Cell 2, 351–361. - PMC - PubMed
    1. Alonso-Monge, R., Real, E., Wojda, I., Bebelman, J. P., Mager, W. H., and Siderius, M. (2001). Hyperosmotic stress response and regulation of cell wall integrity in Saccharomyces cerevisiae share common functional aspects. Mol. Microbiol. 41, 717–730. - PubMed
    1. Alspaugh, J. A., Perfect, J. R., and Heitman, J. (1997). Cryptococcus neoformans mating and virulence are regulated by the G-protein alpha subunit GPA1 and cAMP. Genes Dev. 11, 3206–3217. - PMC - PubMed
    1. Alspaugh, J. A., Pukkila-Worley, R., Harashima, T., Cavallo, L. M., Funnell, D., Cox, G. M., Perfect, J. R., Kronstad, J. W., and Heitman, J. (2002). Adenylyl cyclase functions downstream of the Gα protein Gpa1 and controls mating and pathogenicity of Cryptococcus neoformans. Eukaryot. Cell 1, 75–84. - PMC - PubMed

Publication types

MeSH terms

Substances

LinkOut - more resources