. 2005 Mar 8;102(10):3744-9.
doi: 10.1073/pnas.0407019102. Epub 2005 Feb 23.

HLA-restricted epitope identification and detection of functional T cell responses by using MHC-peptide and costimulatory microarrays

Affiliations

HLA-restricted epitope identification and detection of functional T cell responses by using MHC-peptide and costimulatory microarrays

Jennifer D Stone et al. Proc Natl Acad Sci U S A. .

Abstract

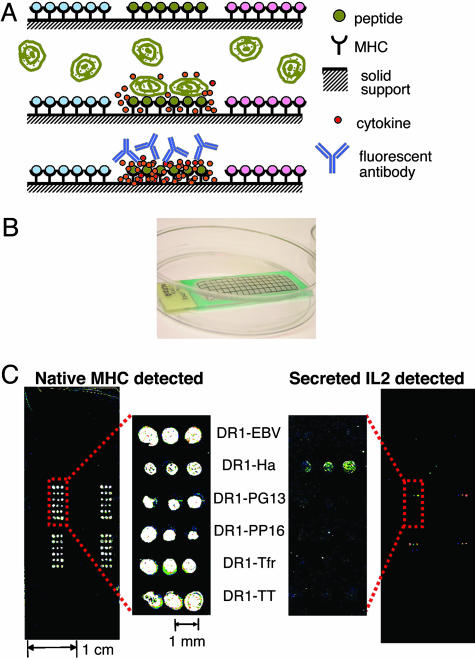
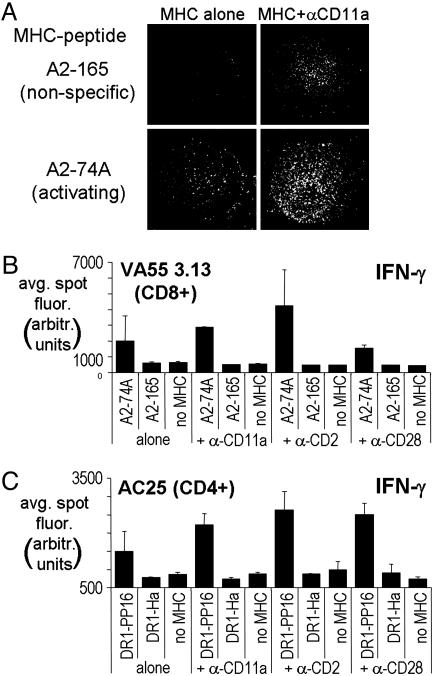
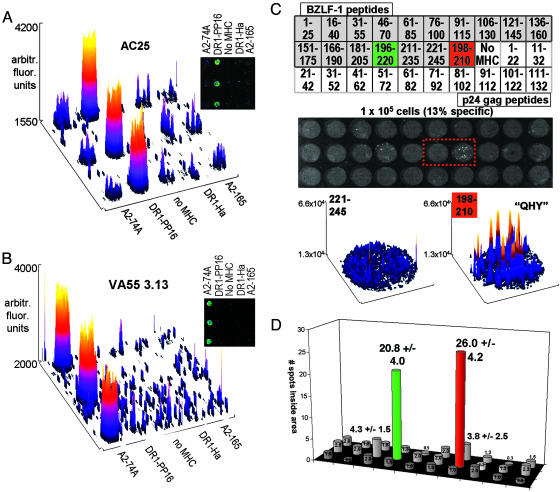
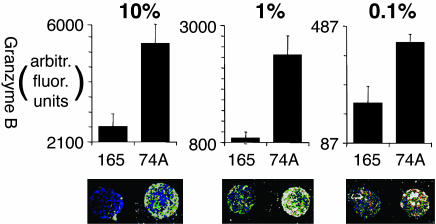
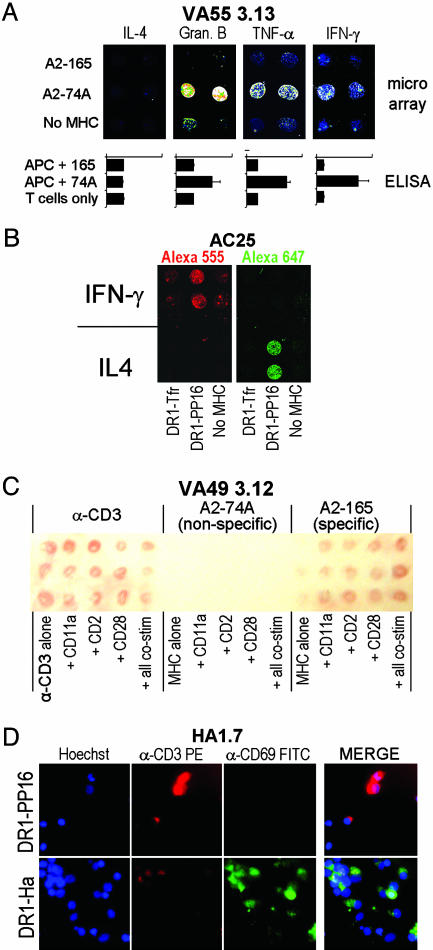
Identification of T cell epitopes is a vital but often slow and difficult step in studying the immune response to infectious agents and autoantigens. We report a spatially addressable technique for screening large numbers of T cell epitopes for both specific antigen recognition and functional activity induced. This system uses microarrays of immobilized, recombinant MHC-peptide complexes, costimulatory molecules, and cytokine-capture antibodies. The array elements act as synthetic antigen-presenting cells and specifically elicit T cell responses, including adhesion, secretion of cytokines, and modulation of surface markers. The method allows facile identification of pertinent T cell epitopes in a large number of candidates and simultaneous determination of the functional outcome of the interaction. Using this method, we have characterized the activation of human CD4(+) and CD8(+) T cells responding to vaccinia, influenza, HIV-1, and Epstein-Barr viruses.


Figures

Fig. 1.
Fig. 1.
Artificial antigen-presentation chips. (A) Schematic representation of artificial antigen-presenting microarray technology. (Top) MHC–peptide complexes immobilized with different peptide antigens in distinct areas. Costimulatory and cytokine-capture antibodies can be coimmobilized (not shown). (Middle) T cells are incubated with the array. Only specific MHC–peptide complexes induce T cell responses. Cytokines are captured locally by immobilized anti-cytokine antibodies. (Bottom) Captured cytokines are detected by labeled antibodies in the locations where they were secreted, identifying the activating epitopes. (B) Photograph of a microarray with solution held in place by a hydrophobic barrier. (C) Microarray carrying various DR1–peptide complexes on a polystyrene slide, incubated with 106 murine hybridoma cells specific to DR1–Ha for 16 h and stained for native MHC with LB3.1-CY5 (Left) and for captured mouse IL-2 by using biotinylated α-mouse-IL-2 preincubated with SA-Alexa Fluor 555 (Right). The pattern was repeated in four areas.
Fig. 2.
Fig. 2.
The effect of costimulation on T cell detection. (A) HLA-A2+ MVA-74A peptide-specific T cells incubated for5honan MHC–peptide array at ≈10 cells per mm2 (3 × 10⁵ cells per chamber on a four-chamber slide) and stained with Hoechst nuclear stain. (Left) MHC complexes were arrayed alone at 50 μg/ml. (Right) α-CD11a adhesion antibodies were coimmobilized with MHCs. (Top) Nonactivating MHC–peptide array elements. (Bottom) Activating MHC–peptide spots. The single spot images shown are characteristic of such spots on replicate arrays. (B and C) Average spot intensities (in arbitrary fluorescence units) for IFN-γ secretion by 106 cells in response to 6-h incubation with array elements incorporating various types of costimulatory antibodies. (B) Response of VA55 3.13, a CD8+ line specific to A2–74A. (C) Response of AC25, a CD4+ clone specific to DR1–PP16.
Fig. 3.
Fig. 3.
Arrayed class I and class II epitopes are specifically recognized by human CD8+ and CD4+ T cells. (A and B) MHC–peptide complexes and α-CD11a antibody were immobilized with α-IFN-γ capture antibody. The chips were incubated with 106 T cells for 6 h, and IFN-γ was detected. Fluorescence intensity on the chip is shown as a 3D surface plot of the array area, and a raw-fluorescence image is shown (Inset). (A) CD4+ clone AC25, specific to DR1–gag. (B) CD8+ line VA55 3.13, specific to A2–74A. (C) Response of a short-term polyclonal human T cell line against the EBV protein BZLF-1 (15) was analyzed by using overlapping peptides covering the sequence of the protein, each in complex with HLA-DR1. Additional spots contained the previously identified minimal epitope peptide QHY (BZLF-1 [198–210]), a series of HIV p24 gag overlapping peptides, and other control complexes for a total of 50 spots in an area of 192 mm2.(Top) A partial map of the array. The array was incubated with 100,000 T cells, of which ≈13% were specific to BZLF-1 by intracellular cytokine staining (≈13,000 specific cells or 60 per mm2). The secreted IFN-γ detected after a 6-h incubation is shown below the map. Small spots, corresponding to cytokines secreted by single responding cells, can be seen within the overall spot areas for two specific arrays; one is from the overlapping peptide series BZLF-1 [196–220] (green), and one is the previously identified minimal epitope BZLF-1 [198–210] (“QHY,” red). Surface plots for the boxed-array elements BZLF-1 [221–245] (nonactivating) and BZLF-1 [198–210] (activating) are shown below the array. Intensity spikes from individual secretion sources can be seen. (D) The average number of such spots observed for each element of the microarray in C is shown as a bar graph with the same layout (n = 4).
Fig. 4.
Fig. 4.
Detection of low-frequency responses. VA55 3.13 CD8+ T cells (specific to HLA-A2 in complex with MVA-74A) were diluted into allogeneic peripheral blood mononuclear cells, and granzyme B secretion was detected on the chips after incubation. In each panel, the total number of cells per chamber was 2.5 × 10⁶. The spots are ≈1 mm in diameter, for an average spot area of 0.75 mm2. Average intensities of spots (n = 2) and a raw-fluorescence image is shown after dilution of VA55 3.13 to 10% of the total cells (100,000 per million; Left), 1% of the total cells (10,000 per million; Center), and 0.1% of the total cells (1,000 per million; Right).
Fig. 5.
Fig. 5.
Analysis of multiple T cell functions. (A) A multichamber LabTek II CC2 slide was prepared with a different capture antibody in each chamber but with identical MHC–peptide and α-CD11a patterns. 2.5 × 10⁵ VA55 3.13 cells (specific to A2–74A) were incubated in each chamber for 6 h, and cytokine secretion was analyzed by using the appropriate detection antibody. Below each image is a bar graph showing the same cytokine detected by a bulk ELISA, where VA55 3.13 T cells are stimulated with peptide-pulsed, HLA-A2+ antigen-presenting cells. (B) A chip was spotted with α-IFN-γ- and α-IL-4-capture antibodies in different areas with the same MHC-peptide and α-CD11a stimuli coimmobilized. The chip was incubated for 6 h with 1 × 10⁶ AC25 T cells (specific to DR1–PP16) and then stained with a mixture of biotinylated α-IFN-γ preincubated with SA-Alexa Fluor 555 and biotinylated α-IL-4 preincubated with SA-Alexa Fluor 647. The chip was scanned at both wavelengths. Red, Alexa Fluor 555; Green, Alexa Fluor 647. (C) Cytokine capture can be detected on the arrays by using precipitating substrate. The array shown was incubated for 24 h with 2 × 10⁶ VA49 3.12 cells, a CD8+ T cell line specific to A2–165. IFN-γ secretion was detected in the regions containing α-CD3 and A2–165 but not A2–74A. (D) Cell-surface protein up-regulation in response to array elements can be detected by using fluorescently labeled antibodies. HA1.7, a CD4+ T cell clone specific to DR1–Ha, was incubated at 2.5 × 10⁶ cells per chamber for 16 h on a microarray containing DR1–PP16 (null; Upper) and DR1–Ha (activating; Lower). Hoechst nuclear stain shows the presence of adhering cells, whereas α-CD3-phycoerythrin and α-CD69-FITC were used to show the relative levels of those activation-linked cell-surface markers. A three-color merge for each stimulus is shown at the right.

References

    1. Collins, K. L. (2003) Curr. HIV Res. 1, 31-40. - PubMed
    1. Levitsky, V. & Masucci, M. G. (2002) Virus Res. 88, 71-86. - PubMed
    1. Terajima, M., Vapalahti, O., Van Epps, H. L., Vaheri, A. & Ennis, F. A. (2004) Microbes Infect. 6, 238-245. - PubMed
    1. Christen, U. & von Herrath, M. G. (2004) Mol. Immunol. 40, 1113-1120. - PubMed
    1. Yamada, A., Ziese, M. R., Young, J. F., Yamada, Y. K. & Ennis, F. A. (1985) J. Exp. Med. 162, 663-674. - PMC - PubMed

Publication types