Tonotopic specialization of auditory coincidence detection in nucleus laminaris of the chick
- PMID: 15728832
- PMCID: PMC6726073
- DOI: 10.1523/JNEUROSCI.4428-04.2005
Tonotopic specialization of auditory coincidence detection in nucleus laminaris of the chick
Abstract
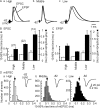
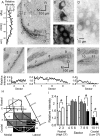
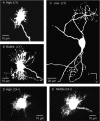
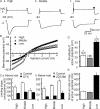
The interaural time difference (ITD) is a cue for localizing a sound source along the horizontal plane and is first determined in the nucleus laminaris (NL) in birds. Neurons in NL are tonotopically organized, such that ITDs are processed separately at each characteristic frequency (CF). Here, we investigated the excitability and coincidence detection of neurons along the tonotopic axis in NL, using a chick brainstem slice preparation. Systematic changes with CF were observed in morphological and electrophysiological properties of NL neurons. These properties included the length of dendrites, the input capacitance, the conductance of hyperpolarization-activated current, and the EPSC time course. In contrast to these gradients, the conductance of low-threshold K+ current and the expression of Kv1.2 channel protein were maximal in the central (middle-CF) region of NL. As a result, the middle-CF neuron had the smallest input resistance and membrane time constant, and consequently the fastest EPSP, and exhibited the most accurate coincidence detection. The specialization of middle-CF neurons as coincidence detectors may account for the high resolution of sound-source localization in the middle-frequency range observed in avians.
Figures


Similar articles
-
Neuronal specializations for the processing of interaural difference cues in the chick.Front Neural Circuits. 2014 May 9;8:47. doi: 10.3389/fncir.2014.00047. eCollection 2014. Front Neural Circuits. 2014. PMID: 24847212 Free PMC article. Review.
-
Hyperpolarization-activated cyclic nucleotide-gated cation channels regulate auditory coincidence detection in nucleus laminaris of the chick.J Neurosci. 2005 Sep 28;25(39):8867-77. doi: 10.1523/JNEUROSCI.2541-05.2005. J Neurosci. 2005. PMID: 16192376 Free PMC article.
-
Early development of intrinsic and synaptic properties of chicken nucleus laminaris neurons.Neuroscience. 2008 Apr 22;153(1):131-43. doi: 10.1016/j.neuroscience.2008.01.059. Epub 2008 Feb 13. Neuroscience. 2008. PMID: 18355968
-
Change in the coding of interaural time difference along the tonotopic axis of the chicken nucleus laminaris.Front Neural Circuits. 2015 Aug 20;9:43. doi: 10.3389/fncir.2015.00043. eCollection 2015. Front Neural Circuits. 2015. PMID: 26347616 Free PMC article.
-
Cellular Strategies for Frequency-Dependent Computation of Interaural Time Difference.Front Synaptic Neurosci. 2022 May 6;14:891740. doi: 10.3389/fnsyn.2022.891740. eCollection 2022. Front Synaptic Neurosci. 2022. PMID: 35602551 Free PMC article. Review.
Cited by
-
Soma-axon coupling configurations that enhance neuronal coincidence detection.PLoS Comput Biol. 2019 Mar 4;15(3):e1006476. doi: 10.1371/journal.pcbi.1006476. eCollection 2019 Mar. PLoS Comput Biol. 2019. PMID: 30830905 Free PMC article.
-
Neuronal specializations for the processing of interaural difference cues in the chick.Front Neural Circuits. 2014 May 9;8:47. doi: 10.3389/fncir.2014.00047. eCollection 2014. Front Neural Circuits. 2014. PMID: 24847212 Free PMC article. Review.
-
Theoretical relation between axon initial segment geometry and excitability.Elife. 2020 Mar 30;9:e53432. doi: 10.7554/eLife.53432. Elife. 2020. PMID: 32223890 Free PMC article.
-
Neural networks a century after Cajal.Brain Res Rev. 2007 Oct;55(2):264-84. doi: 10.1016/j.brainresrev.2007.06.003. Epub 2007 Jul 13. Brain Res Rev. 2007. PMID: 17692925 Free PMC article. Review.
-
On the origin of the extracellular field potential in the nucleus laminaris of the barn owl (Tyto alba).J Neurophysiol. 2010 Oct;104(4):2274-90. doi: 10.1152/jn.00395.2010. Epub 2010 Aug 4. J Neurophysiol. 2010. PMID: 20685926 Free PMC article.
References
-
- Agmon-Snir H, Carr CE, Rinzel J (1998) The role of dendrites in auditory coincidence detection. Nature 393: 268-272. - PubMed
-
- Barnes-Davies M, Barker MC, Osmani F, Forsythe ID (2004) Kv1 currents mediate a gradient of principal neuron excitability across the tonotopic axis in the rat lateral superior olive. Eur J Neurosci 19: 325-333. - PubMed
-
- Brown TH, Fricke RA, Perkel DH (1981) Passive electrical constants in three classes of hippocampal neurons. J Neurophysiol 4: 812-827. - PubMed
-
- Bruckner S, Hyson RL (1998) Effect of GABA on the processing of interaural time differences in nucleus laminaris neurons in the chick. Eur J Neurosci 10: 3438-3450. - PubMed
-
- Carr CE, Boudreau RE (1993a) Organization of the nucleus magnocellularis and the nucleus laminaris in the barn owl: encoding and measuring interaural time differences. J Comp Neurol 334: 337-355. - PubMed
Publication types
MeSH terms
Substances
LinkOut - more resources
Full Text Sources
Research Materials
