. 2005 Feb 24;433(7028):895-900.
doi: 10.1038/nature03288.

Functional cartography of complex metabolic networks

Affiliations

Functional cartography of complex metabolic networks

Roger Guimerà et al. Nature. .

Abstract

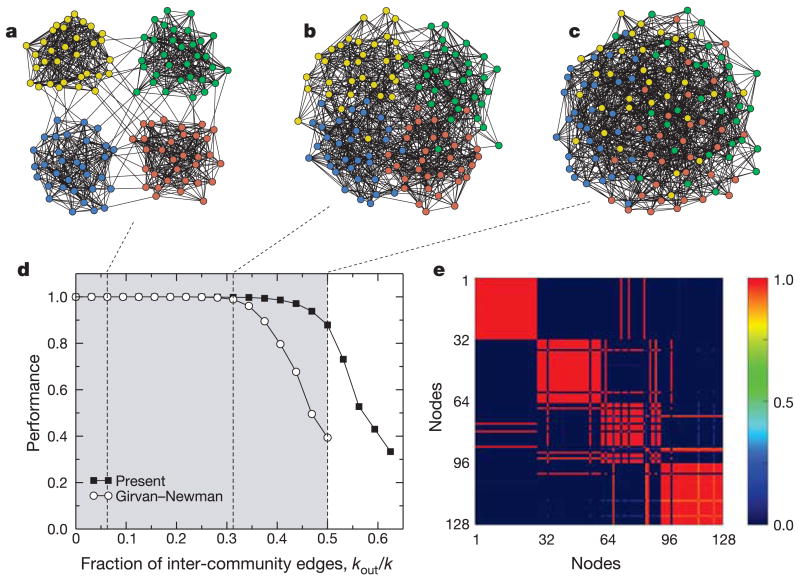
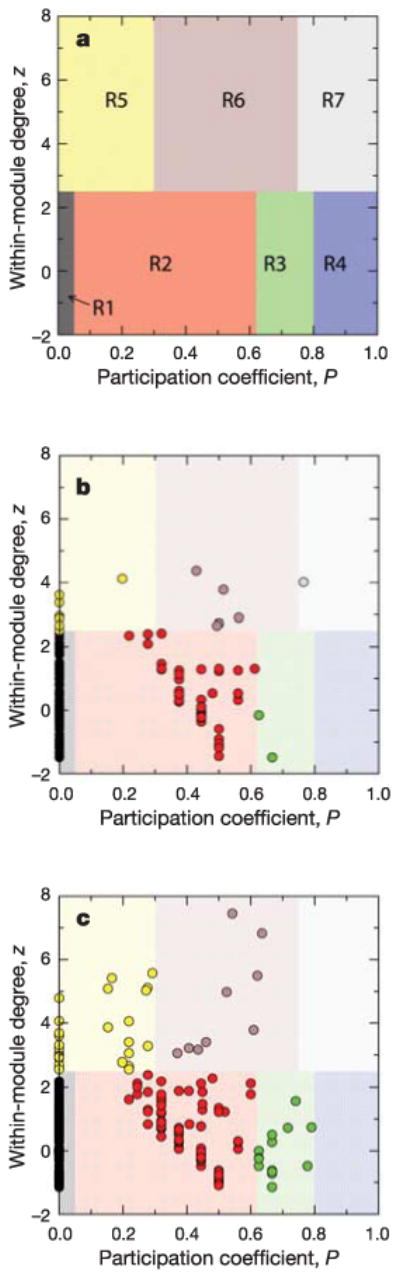
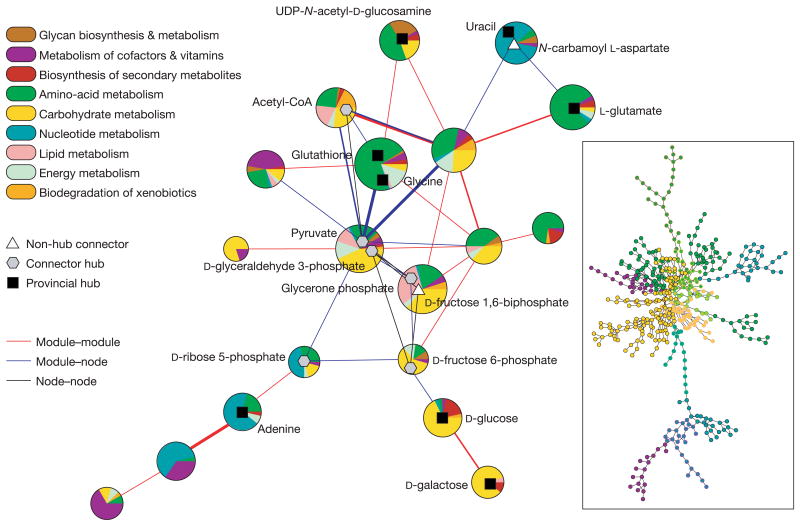
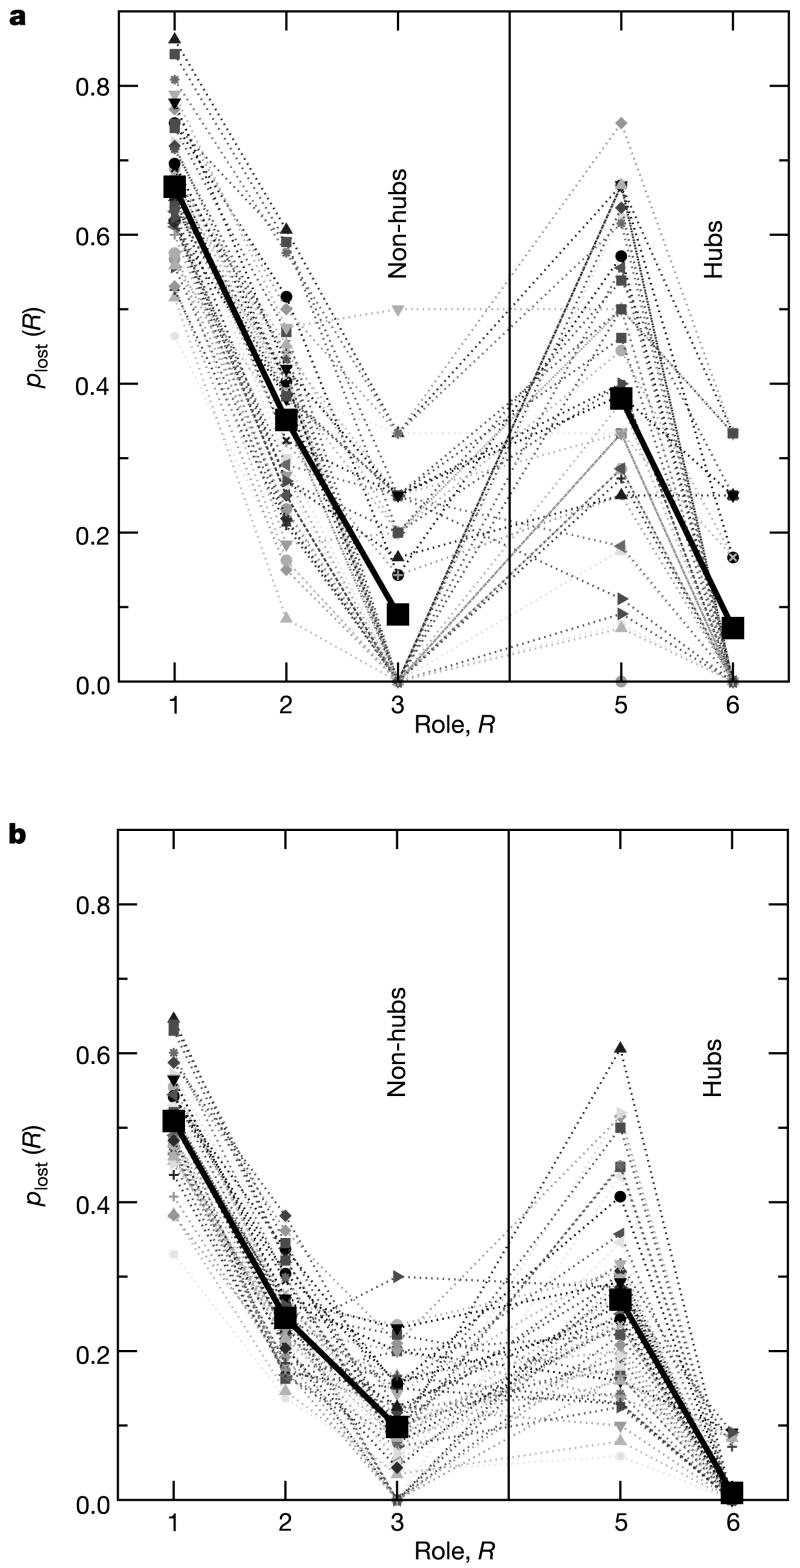
High-throughput techniques are leading to an explosive growth in the size of biological databases and creating the opportunity to revolutionize our understanding of life and disease. Interpretation of these data remains, however, a major scientific challenge. Here, we propose a methodology that enables us to extract and display information contained in complex networks. Specifically, we demonstrate that we can find functional modules in complex networks, and classify nodes into universal roles according to their pattern of intra- and inter-module connections. The method thus yields a 'cartographic representation' of complex networks. Metabolic networks are among the most challenging biological networks and, arguably, the ones with most potential for immediate applicability. We use our method to analyse the metabolic networks of twelve organisms from three different superkingdoms. We find that, typically, 80% of the nodes are only connected to other nodes within their respective modules, and that nodes with different roles are affected by different evolutionary constraints and pressures. Remarkably, we find that metabolites that participate in only a few reactions but that connect different modules are more conserved than hubs whose links are mostly within a single module.


Conflict of interest statement

Competing interests statement The authors declare that they have no competing financial interests.

Figures

Figure 1
Figure 1
Performance of module identification methods. To test the performance of the method, we build ‘random networks’ with known module structure. Each test network comprises 128 nodes divided into 4 modules of 32 nodes. Each node is connected to the other nodes in its module with probability pi, and to nodes in other modules with probability po < pi. On average, thus, each node is connected to kout = 96 po nodes in other modules and to kin = 31 pi in the same module. Additionally, pi and po are selected so that the average degree of the nodes is k = 16. We display networks with: a, kin = 15 and kout = 1; b, kin = 11 and kout = 5; and c, kin = kout = 8. d, The performance of a module identification algorithm is typically defined as the fraction of correctly classified nodes. We compare our algorithm to the Girvan–Newman algorithm,, which is the reference algorithm for module identification,,. Note that our method is 90% accurate even when half of a node's links are to nodes in outside modules. e, Our module-identification algorithm is stochastic, so different runs yield, in principle, different partitions. To test the robustness of the algorithm, we obtain 100 partitions of the network depicted in c and plot, for each pair of nodes in the network, the fraction of times that they are classified in the same module. As shown in the figure, most pairs of nodes are either always classified in the same module (red) or never classified in the same module (dark blue), which indicates that the solution is robust.
Figure 2
Figure 2
Roles and regions in the zP parameter space. a, Each node in a network can be characterized by its within-module degree and its participation coefficient (see Methods for definitions). We classify nodes with z ≥ 2.5 as module hubs and nodes with z < 2.5 as non-hubs. We find that non-hub nodes can be naturally assigned into four different roles: (R1) ultra-peripheral nodes; (R2) peripheral nodes; (R3) non-hub connector nodes; and (R4) non-hub kinless nodes. We find that hub nodes can be naturally assigned into three different roles: (R5) provincial hubs; (R6) connector hubs; and (R7) kinless hubs (see text and Supplementary Information for details). b, Metabolite role determination for the metabolic network of E. coli, as obtained from the MZ database. Each metabolite is represented as a point in the zP parameter space, and is coloured according to its role. c, Same as b but for the complete KEGG database.
Figure 3
Figure 3
Cartographic representation of the metabolic network of E. coli. Each circle represents a module and is coloured according to the KEGG pathway classification of the metabolites it contains. Certain important nodes are depicted as triangles (non-hub connectors), hexagons (connector hubs) and squares (provincial hubs). Interactions between modules and nodes are depicted using lines, with thickness proportional to the number of actual links. Inset: metabolic network of E. coli, which contains 473 metabolites and 574 links. This representation was obtained using the program Pajek. Each node is coloured according to the ‘main’ colour of its module, as obtained from the cartographic representation.
Figure 4
Figure 4
Roles of metabolites and inter-species conservation. To quantify the relation between roles and conservation, we calculate the loss rate plost(R) of each metabolite (see Methods). Each thin line in the graph corresponds to a comparison between two species. Because we are interested in metabolites that are present in some species but missing in others, metabolic networks of species within the same superkingdom—bacteria, eukaryotes and archaea—are usually too similar to provide statistically sound information, especially for roles containing only a few metabolites. Therefore, we consider in our analysis only pairs of species that belong to different superkingdoms. The thick line is the average over all pairs of species. The loss rate plost(R) is maximum for ultra-peripheral (R1) nodes and minimum for connector hubs (R6). Provincial hubs (R5) have a significantly and consistently higher plost(R) than non-hub connectors (R3), even though the within-module degree and the total degree of provincial hubs is larger. Note that, out of the total 48 pair comparisons, only in two cases is plost(R) lower for provincial hubs than for non-hub connectors, whereas the opposite is true in 44 cases. a, b, Results obtained for the MZ database (a) and the complete KEGG database (b).

References

    1. Amaral LAN, Scala A, Barthelémy M, Stanley HE. Classes of small-world networks. Proc Natl Acad Sci USA. 2000;97:11149–11152. - PMC - PubMed
    1. Albert R, Barabási AL. Statistical mechanics of complex networks. Rev Mod Phys. 2002;74:47–97.
    1. Amaral LAN, Ottino J. Complex networks: Augmenting the framework for the study of complex systems. Eur Phys J B. 2004;38:147–162.
    1. Hartwell LH, Hopfield JJ, Leibler S, Murray AW. From molecular to modular biology. Nature. 1999;402(Suppl):C47–C52. - PubMed
    1. Girvan M, Newman MEJ. Community structure in social and biological networks. Proc Natl Acad Sci USA. 2002;99:7821–7826. - PMC - PubMed

Publication types

Substances