Comparative Study
. 2005 Feb 24:6:13.
doi: 10.1186/1471-2202-6-13.

Glutamate-induced apoptosis in primary cortical neurons is inhibited by equine estrogens via down-regulation of caspase-3 and prevention of mitochondrial cytochrome c release

Affiliations
Comparative Study

Glutamate-induced apoptosis in primary cortical neurons is inhibited by equine estrogens via down-regulation of caspase-3 and prevention of mitochondrial cytochrome c release

YueMei Zhang et al. BMC Neurosci. .

Abstract

Background: Apoptosis plays a key role in cell death observed in neurodegenerative diseases marked by a progressive loss of neurons as seen in Alzheimer's disease. Although the exact cause of apoptosis is not known, a number of factors such as free radicals, insufficient levels of nerve growth factors and excessive levels of glutamate have been implicated. We and others, have previously reported that in a stable HT22 neuronal cell line, glutamate induces apoptosis as indicated by DNA fragmentation and up- and down-regulation of Bax (pro-apoptotic), and Bcl-2 (anti-apoptotic) genes respectively. Furthermore, these changes were reversed/inhibited by estrogens. Several lines of evidence also indicate that a family of cysteine proteases (caspases) appear to play a critical role in neuronal apoptosis. The purpose of the present study is to determine in primary cultures of cortical cells, if glutamate-induced neuronal apoptosis and its inhibition by estrogens involve changes in caspase-3 protease and whether this process is mediated by Fas receptor and/or mitochondrial signal transduction pathways involving release of cytochrome c.

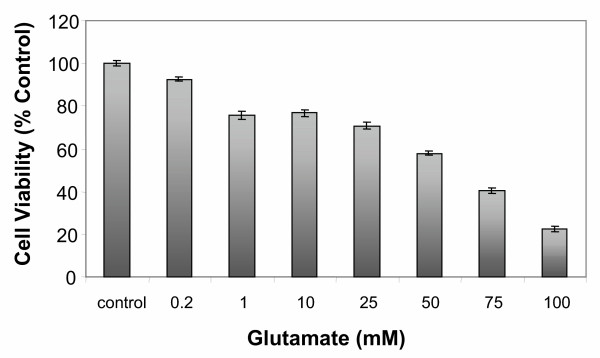
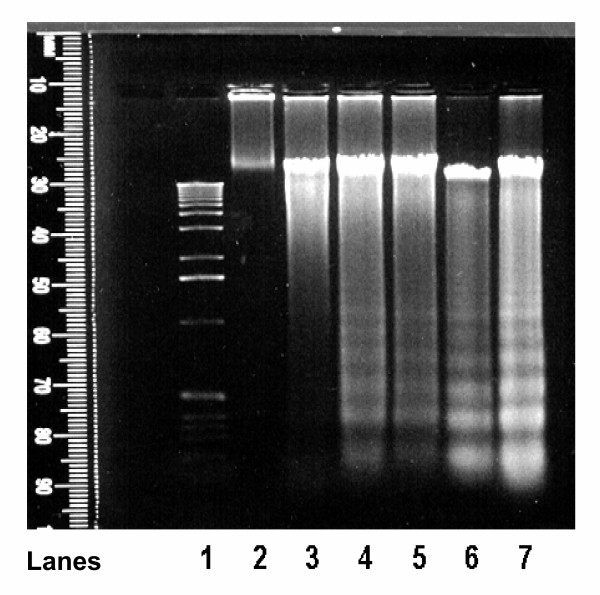
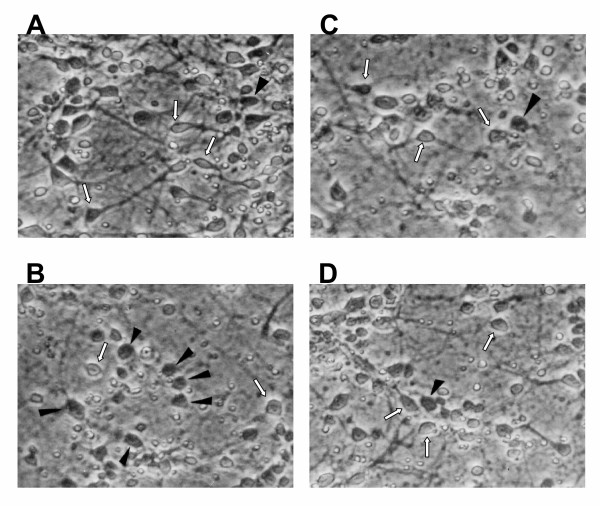
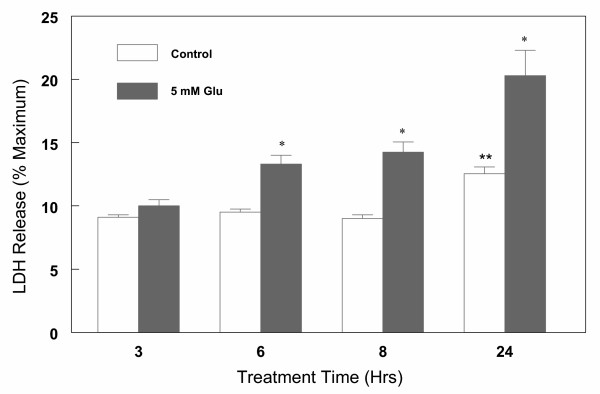
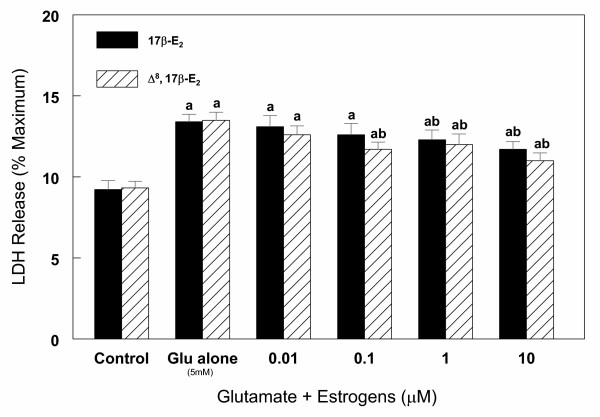
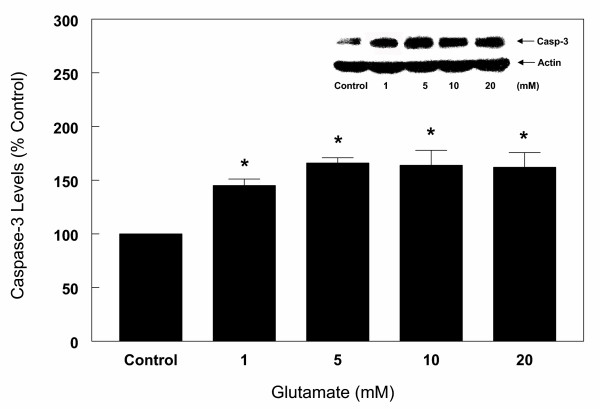
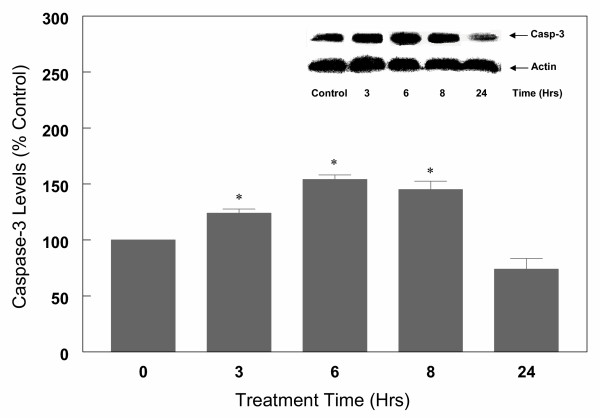
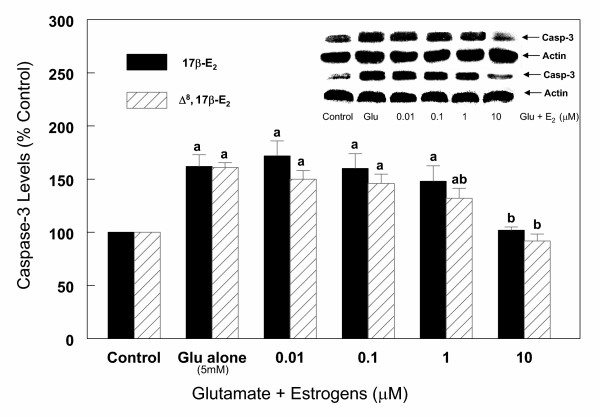
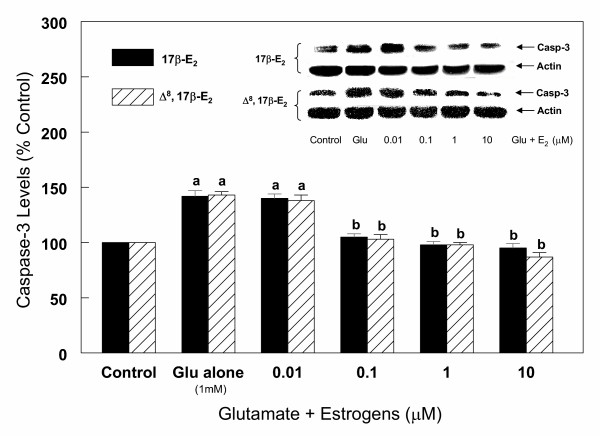
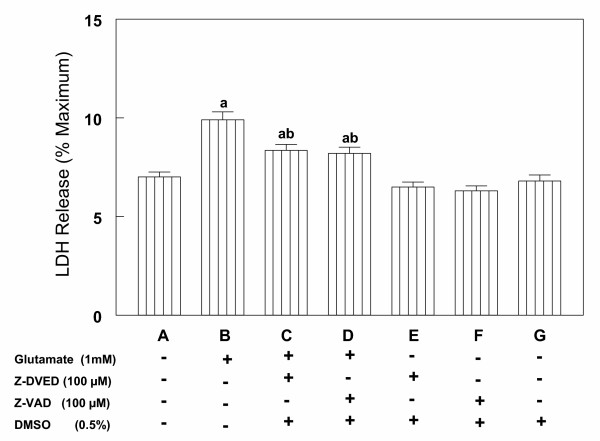
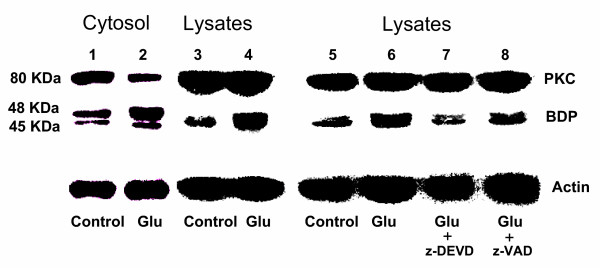
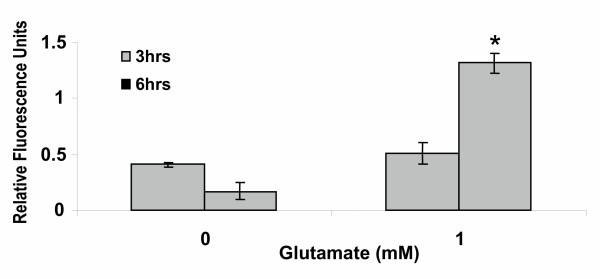
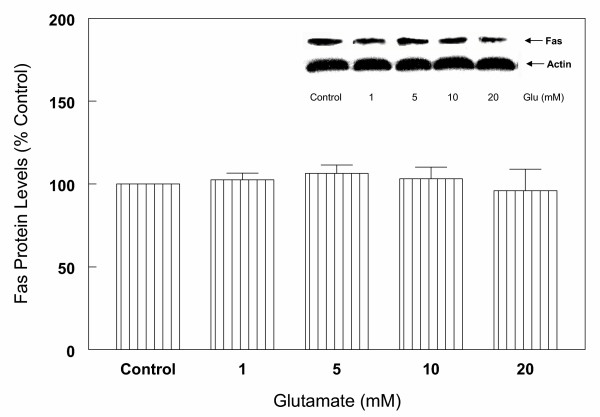
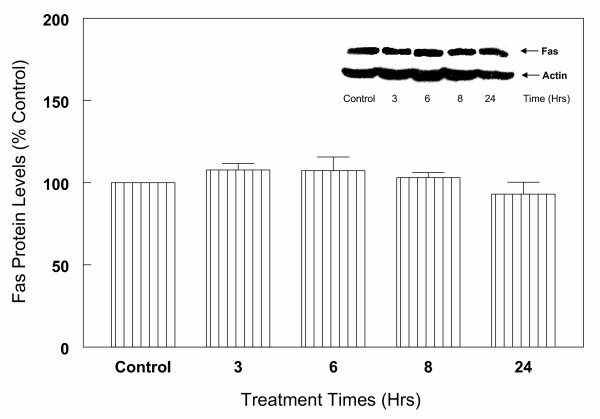
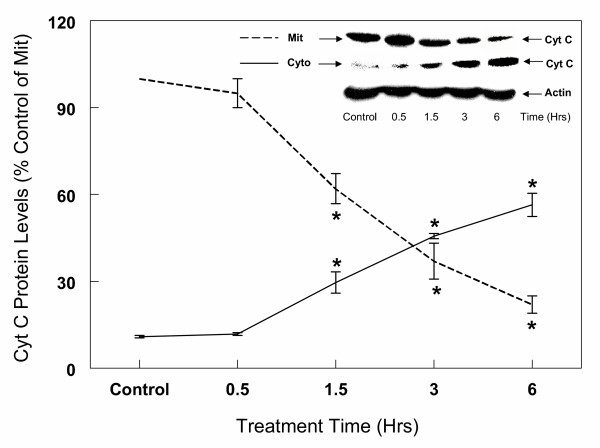
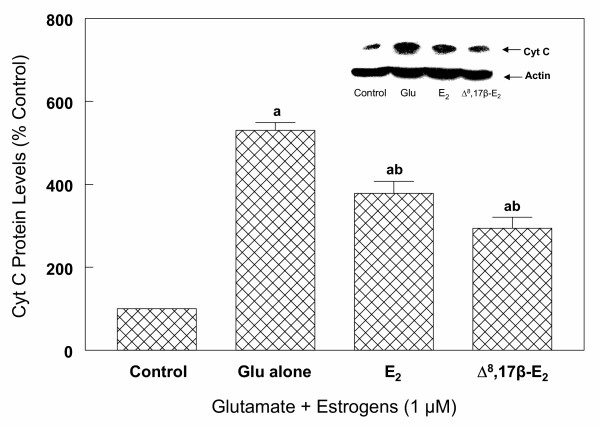
Results: In primary cultures of rat cortical cells, glutamate induced apoptosis that was associated with enhanced DNA fragmentation, morphological changes, and up-regulation of pro-caspase-3. Exposure of cortical cells to glutamate resulted in a time-dependent cell death and an increase in caspase-3 protein levels. Although the increase in caspase-3 levels was evident after 3 h, cell death was only significantly increased after 6 h. Treatment of cells for 6 h with 1 to 20 mM glutamate resulted in a 35 to 45% cell death that was associated with a 45 to 65% increase in the expression of caspase-3 protein. Pretreatment with caspase-3-protease inhibitor z-DEVD or pan-caspase inhibitor z-VAD significantly decreased glutamate-induced cell death of cortical cells. Exposure of cells to glutamate for 6 h in the presence or absence of 17beta-estradiol or Delta8, 17beta-estradiol (10 nM-10 microM) resulted in the prevention of cell death and was associated with a significant dose-dependent decrease in caspase-3 protein levels, with Delta8, 17beta-E2 being more potent than 17beta-E2. Protein levels of Fas receptor remained unchanged in the presence of glutamate. In contrast, treatment with glutamate induced, in a time-dependent manner, the release of cytochrome c into the cytosol. Cytosolic cytochrome c increased as early as 1.5 h after glutamate treatment and these levels were 5 fold higher after 6 h, compared to levels in the untreated cells. Concomitant with these changes, the levels of cytochrome c in mitochondria decreased significantly. Both 17beta-E2 and Delta8, 17beta-E2 reduced the release of cytochrome c from mitochondria into the cytosol and this decrease in cytosolic cytochrome c was associated with inhibition of glutamate-induced cell death.

Conclusion: In the primary cortical cells, glutamate-induced apoptosis is accompanied by up-regulation of caspase-3 and its activity is blocked by caspase protease inhibitors. These effects of glutamate on caspase-3 appear to be independent of changes in Fas receptor, but are associated with the rapid release of mitochondrial cytochrome c, which precedes changes in caspase-3 protein levels leading to apoptotic cell death. This process was differentially inhibited by estrogens with the novel equine estrogen Delta8, 17beta-E2 being more potent than 17beta-E2. To our knowledge, this is the first study to demonstrate that equine estrogens can prevent glutamate-induced translocation of cytochrome c from mitochondria to cytosol in rat primary cortical cells.


Figures

Figure 1
Figure 1
Effects of various concentrations of glutamate on cell viability. Primary cortical cells isolated from 18–20 day old fetal rat brains were cultured for 7 days and then treated with various concentrations of glutamate or in absence of glutamate (control) for 18 h. Cell viability was determined using the MTS cell proliferation assay as described under "Methods". Cell viability is expressed as the mean (± SEM) from three experiments. * P < 0.05 (1-100 mM)compared with untreated control cells.
Figure 2
Figure 2
Detection of glutamate induced DNA fragmentation (DNA ladder) Primary cortical cells isolated from 18–20 day old fetal rat brains were cultured for 7 days and treated with 1 mM glutamate for 18 h. The cells were processed as described under "Methods". The isolated DNA was electrophoresed on TBE agarose gel for 1.5 h at 100 V. The DNA fragments were visualized by staining with ethidium bromide. Lane 1 = 1 kb DNA ladder; lane 2 = DNA from untreated cortical cells prior to culture; lane 3 = DNA from untreated control cells cultured for 1 day; lane 4 = DNA from untreated control cells cultured for 2 days; lane 5 = DNA from cells cultured for 2 days and treated with glutamate for 18 h; lane 6 = DNA from untreated control cells cultured for 7 days; lane 7 = DNA from cells cultured for 7 days and then treated for 18 h with glutamate. Note the potentiation of DNA fragmentation in presence of glutamate.
Figure 3
Figure 3
Glutamate-induced toxicity in rat primary cortical cells as assessed by phase contrast microscopy (100×). Primary cortical cells isolated from 19 day old fetal rat brains were cultured for 7 days and then treated with 1 mM glutamate alone or in the presence of estrogens for 6 h. Degenerated cells are depicted by arrowheads. A = untreated control cells; B = cells treated with 1 mM glutamate for 6 h; C = cells treated with 1 mM glutamate and 1 μM 17β-E2; D = cells treated with 1 mM glutamate and 1 μM Δ8, 17β-E2. Note after glutamate treatment, dead cells with loss of dendrites are clearly visible in the cultures. In contrast, either untreated control cells or cells treated with glutamate in presence of estrogens retain their normal morphology. Dendrites and membranes are clearly visible and only a few degenerated cells are present in these cultures (A,C,D).
Figure 4
Figure 4
Kinetics of glutamate-induced cell death in primary cortical cells. Cortical cells isolated from 19 day old fetal rat brains were cultured for 7 days and treated with 5 mM glutamate for the indicated times in a neurobasal medium containing 2% antioxidant free B27. LDH release (% maximum) was measured after 3,6,8 and 24 h of treatment. Data are the mean ± SEM values from at least 3 experiments. *P < 0.05 compared with control ** P < 0.05 compared to 3,6,8 h control.
Figure 5
Figure 5
Effect of various concentrations of 17β-E2 and Δ8, 17β-E2 on glutamate (5 mM) induced cell death in primary cortical cells. Cortical cells isolated from 19 day old fetal rat brains were cultured for 7 days and treated with 5 mM glutamate alone or in the presence of estrogens in neurobasal medium containing 2% antioxidant free B27. LDH release (% maximum) was measured after 6 h treatment. Data are the mean ± SEM values from at least 3 experiments. a = P < 0.05 compared with untreated control cells; b = P < 0.05 compared with glutamate alone.
Figure 6
Figure 6
Effects of various concentrations of glutamate on caspase-3 protein levels in primary cortical cells. Cortical cells isolated from 19 day old fetal rat brains were cultured for 7 days and treated with 1,5,10 and 20 mM glutamate for 6 h in a neurobasal medium containing 2% antioxidant free B27. Cells were then harvested and total protein was extracted. Caspase-3 protein levels were assessed by Western blot analysis as described under "Methods". Actin was used as loading control. The bars depict densitometric analyses of Western blots from at least three experiments (± SEM). *P < 0.05 compared with untreated control cells.
Figure 7
Figure 7
Kinetics of glutamate (5 mM) treatment on caspase-3 protein levels in primary cortical cells. Cortical cells isolated from 19 day old fetal rat brains were cultured for 7 days and treated with 5 mM glutamate for the indicated times in a neurobasal medium containing 2% antioxidant free B27. Cells were then collected and total protein was extracted. Caspase-3 protein levels were determined by Western blot analysis as described in Figure 6. The bars depict densitometric analyses of Western blots from at least three experiments (± SEM). *P < 0.05 compared to untreated control cells.
Figure 8
Figure 8
Effects of estrogens on caspase-3 protein levels during glutamate (5 mM) induced cell death in primary cortical cells. Cortical cells isolated from 19 day old fetal rat brains were cultured for 7 days and treated with 5 mM glutamate alone or in the presence of 17β-E2 and Δ8, 17β-E2 for 6 h. Cells were then harvested and total protein was extracted. Caspase-3 protein levels were determined by Western blot analysis as described under Figure 6. The bars depict densitometric analyses of Western blots from at least three experiments (± SEM). a = P < 0.05 compared with untreated control cells, b = P < 0.05 compared with glutamate alone.
Figure 9
Figure 9
Effects of estrogens on caspase-3 protein levels during glutamate (1 mM) induced cell death in primary cortical cells. Cortical cells isolated from 19 day old fetal rat brains were cultured for 7 days and treated with 1 mM glutamate alone or in the presence of 17β-E2 and Δ8, 17β-E2 for 6 h. Cells were then harvested and total protein was extracted. Caspase-3 protein levels were determined by Western blot analysis as described under Figure 6. The bars depict densitometric analyses of Western blots from at least three experiments (± SEM). a = P < 0.05 compared with untreated control cells, b = P < 0.05 compared with glutamate alone.
Figure 10
Figure 10
Effects of caspase inhibitors on glutamate-induced cell death in primary cortical cells. Cortical cells isolated from 19 day old fetal rat brains were cultured for 7 days. Cell death was measured by LDH release assay 6 h after incubation with 1 mM glutamate with or without 30 min pretreatment with 100 μM caspase-3 specific inhibitor z-DEVD or a pan-caspase inhibitor z-VAD (A,B,C and D). Inhibitors alone (E and F) or DMSO (G) had not effect on LDH release. Data are the mean ± SEM for 3 experiments performed. a = P < 0.05 compared with control, b = P < 0.05 compared with glutamate alone.
Figure 11
Figure 11
Effect of caspase inhibitors on proteolytic cleavage of PKC in primary cortical cells treated with glutamate. Primary cortical cells were cultured for 7 days and then treated with 1 mM glutamate with or without 30 minutes of pre-treatment with 100 μM caspase-3 specific inhibitor z-DEVD or a pan-caspase inhibitor z-VAD. After 6 h cells were harvested and total protein was extracted from the cytosol and cell lysates. PKC and its fragments were assessed by Western blot analysis as described under "Methods". Immunoblots indicate the presence of PKC (80 kDa) and its 48 kDa and 45 kDa breakdown products (BDPs). Note that glutamate treatment results in the formation of greater amounts of the 2 BDPs (lanes 2 and 4) in the cytosol and cell lysates compared to the untreated controls (lanes 1 and 3). Pre-treatment of cortical cells with 100 μM z-DEVD or z-VAD prior to glutamate inhibits the formation of PKC to its BDPs to levels seen in untreated control cells (lanes 7,8).
Figure 12
Figure 12
Detection of active caspase-3 by immunofluorescence. Primary cortical cells were cultured for 7 days in 96-well microplates and then treated with or without 1 mM glutamate for 3 h and 6 h. The cells were fixed and then incubated first with primary rabbit anti-cleaved caspase-3 antibody and then with FITC-goat anti-rabbit secondary antibody as described under "Methods". After aspiration, the cells were washed twice with PBS + saponin and the relative fluorescence measured using a Labsystem Fluroskan Accent FL microplate reader (excitation 490 nm; 520 nm emission). The bars depict relative fluorescence units from 3 measurements (± SEM). P < 0.05 compared to control untreated cells.
Figure 13
Figure 13
Effects of various concentration of glutamate on Fas receptor protein levels in primary cortical cells. Cortical cells isolated from 19 day old fetal rat brains were cultured for 7 days and treated with 1,5,10 and 20 mM glutamate for 6 h. Cells were harvested and total protein was extracted. Fas receptor protein levels were assessed by Western blot analysis as described under Figure 6. The results show that glutamate had no significant effect on Fas receptors. Data are the mean (± SEM) from 3 experiments.
Figure 14
Figure 14
Kinetics of glutamate (5 mM) treatment on Fas protein levels in primary cortical cells. Cortical cells isolated from 19 day old fetal rat brains were cultured for 7 days and treated with 5 mM glutamate for the indicated times. Cells were collected and total protein was extracted. Fas receptor protein levels were determined by Western blot analysis as described under Figure 6. The results show that glutamate has no significant effects on Fas receptors up to 24 h of treatment. Data are the mean (± SEM) from 3 experiments.
Figure 15
Figure 15
Kinetics of glutamate (1 mM) induced Cyto c release from mitochondria into cytosol in primary cortical cells. Primary cortical cells isolated from 19 day old fetal rat brains were cultured for 7 days and then treated with 1 mM glutamate for the indicated times. Mitochondrial and cytosol fractions were isolated as described in "Methods". Protein levels of Cyto c in mitochondria and cytosol were determined by Western Blot analysis as described under Figure 6. Actin bands were also used to monitor the same blot to verify consistency of cytosolic protein loading. The content of Cyto c was measured by densitometric scanning of the film. The results are the mean (± SEM) of at least three experiments. *P < 0.05 compared with control.
Figure 16
Figure 16
Effects of 17β-E2 and Δ8, 17β-E2 on glutamate-induced Cyto c release into cytosol in primary cortical cells. Primary cortical cells isolated from 19 day old fetal rat brains were cultured for 7 days and treated with 1 mM glutamate alone or in the presence of 17β-E2 and Δ8, 17β-E2. After 6 h, cells were collected and cytosol fraction was prepared as described under "Methods". Cytosolic protein levels of Cyto c were determined by Western blot analysis as described under Figure 6. Actin bands were used to monitor the same blot to verify consistency of protein loading. The content of Cyto c was measured by densitometric scanning of the film. The results are the mean (± SEM) of at least three experiments. a = P < 0.05 compared with control; b = P < 0.05 compared with glutamate treated cells.

References

    1. Fonnum F. Glutamate: a neurotransmitter in mammalia brain. J Neurochem. 1984;42:1–11. - PubMed
    1. Coyle JT, Puttfarcken P. Oxidative stress, glutamate, and neurodegenerative disorders. Science. 1993;262:689–95. - PubMed
    1. Choi DW. Glutamate receptors and the induction of excitotoxic neuronal death. Prog Brain Res. 1994;100:47–51. - PubMed
    1. Lipton SA, Rosenberg PA. Excitatory amino acids as a final common pathway for neurologic disorder. N Engl J Med. 1994;330:613–22. doi: 10.1056/NEJM199403033300907. - DOI - PubMed
    1. Froissard P, Duval D. Cytotoxic effects of glutamic acid on PC12 cells. Neurochem Int. 1994;24:485–93. doi: 10.1016/0197-0186(94)90096-5. - DOI - PubMed

Publication types

MeSH terms