. 2005 Mar;73(3):1568-77.
doi: 10.1128/IAI.73.3.1568-1577.2005.

A live and inactivated Chlamydia trachomatis mouse pneumonitis strain induces the maturation of dendritic cells that are phenotypically and immunologically distinct

Affiliations

A live and inactivated Chlamydia trachomatis mouse pneumonitis strain induces the maturation of dendritic cells that are phenotypically and immunologically distinct

Jose Rey-Ladino et al. Infect Immun. 2005 Mar.

Abstract

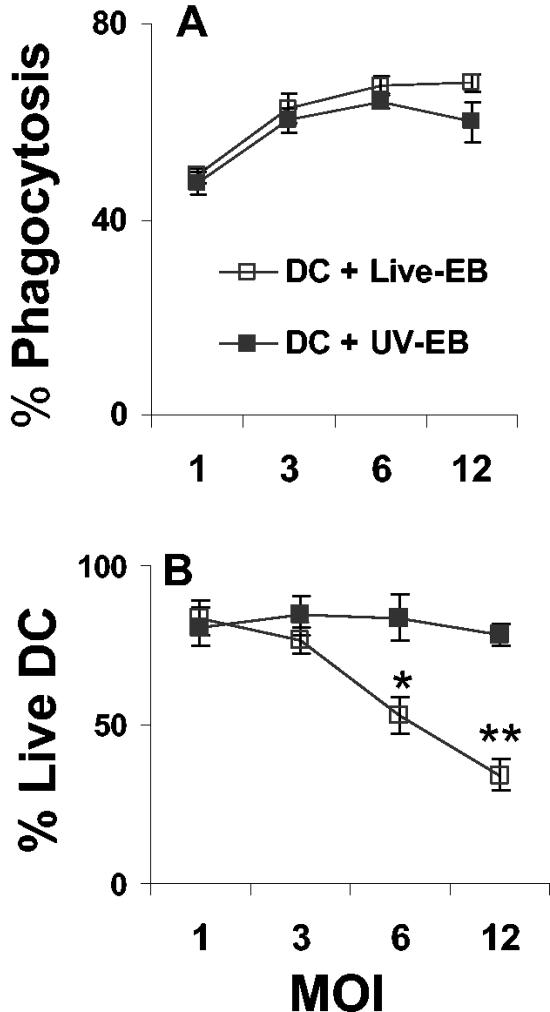
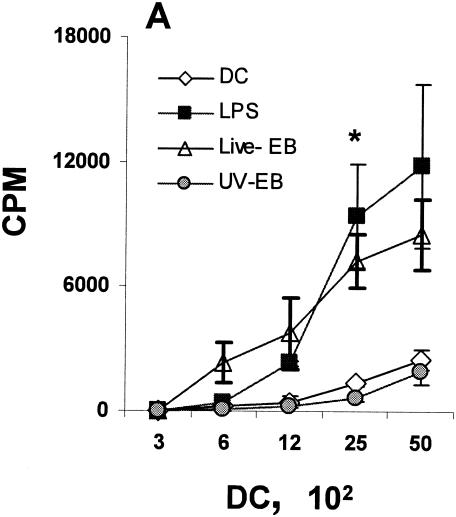
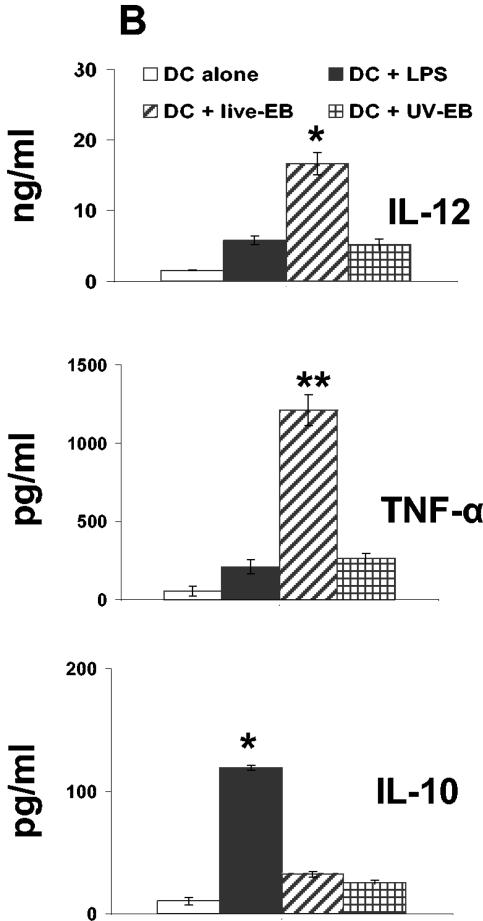
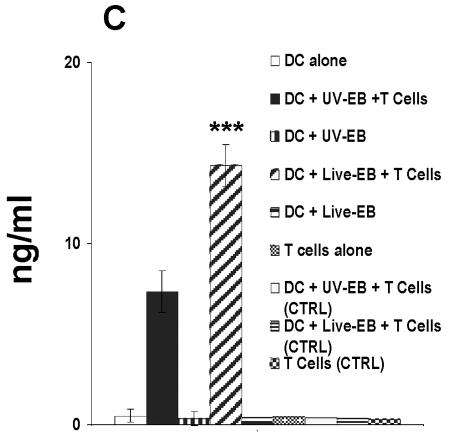
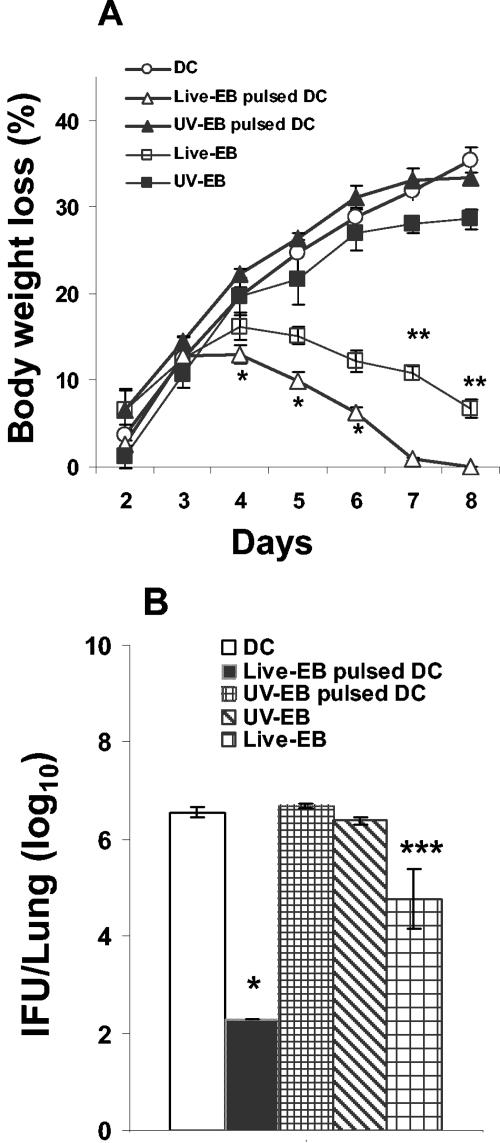
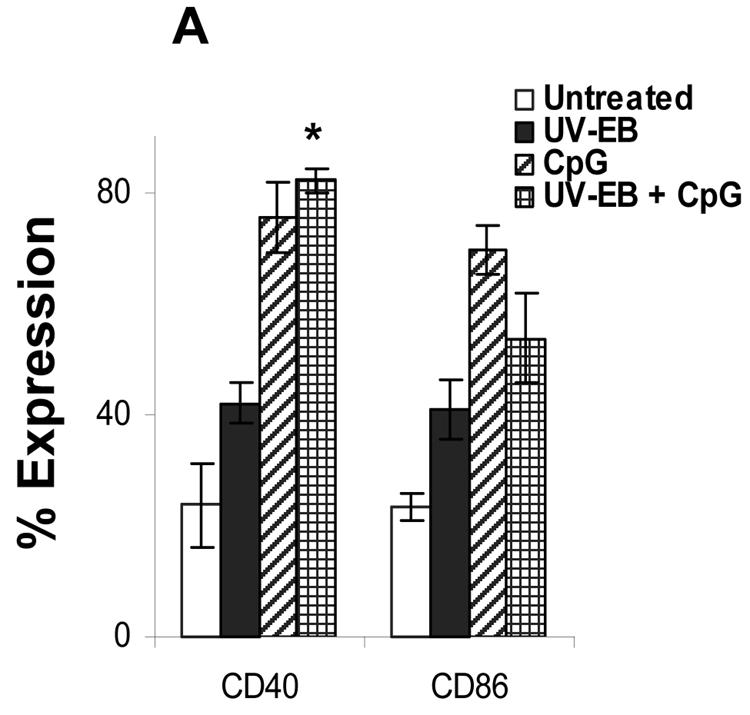
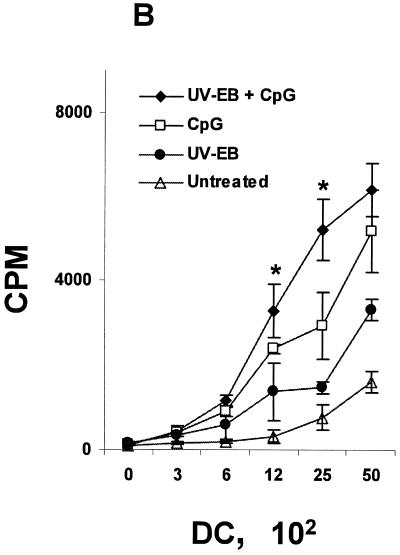
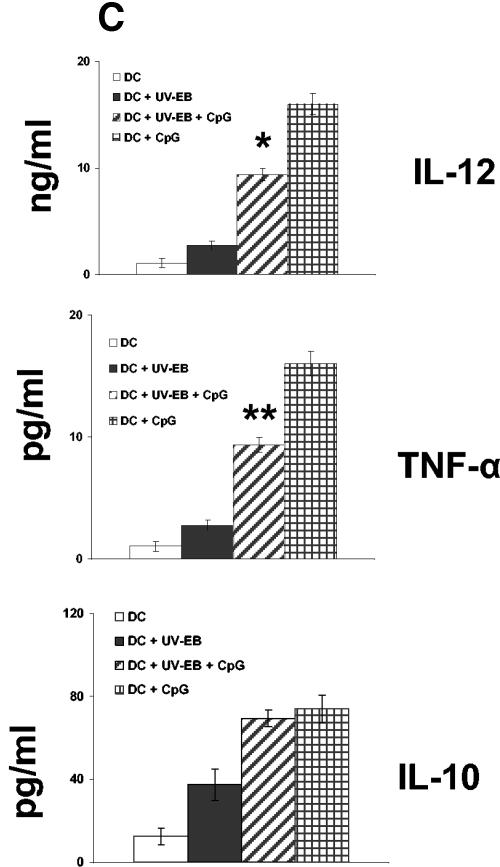
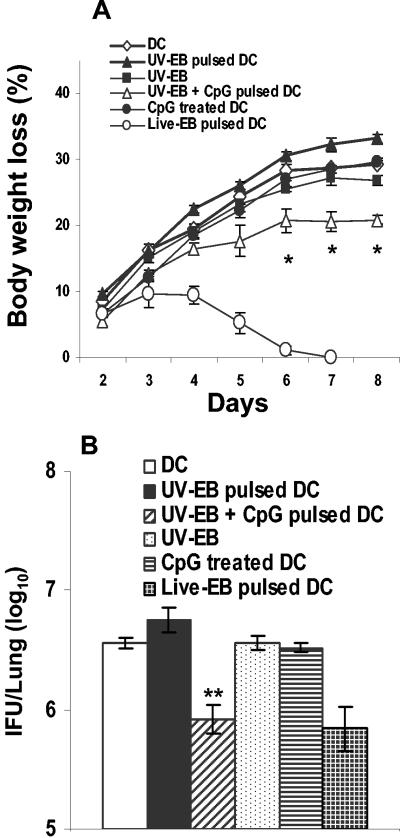
The intracellular bacterial pathogen Chlamydia trachomatis is a major cause of sexually transmitted disease worldwide. While protective immunity does appear to develop following natural chlamydial infection in humans, early vaccine trials using heat-killed C. trachomatis resulted in limited and transient protection with possible enhanced disease during follow-up. Thus, immunity following natural infection with live chlamydia may differ from immune responses induced by immunization with inactivated chlamydia. To study this differing immunology, we used murine bone marrow-derived dendritic cells (DC) to examine DC maturation and immune effector function induced by live and UV-irradiated C. trachomatis elementary bodies (live EBs and UV-EB, respectively). DC exposed to live EBs acquired a mature DC morphology; expressed high levels of major histocompatibility complex (MHC) class II, CD80, CD86, CD40, and ICAM-1; produced elevated amounts of interleukin-12 and tumor necrosis factor alpha; and were efficiently recognized by Chlamydia-specific CD4+ T cells. In contrast, UV-EB-pulsed DC expressed low levels of CD40 and CD86 but displayed high levels of MHC class II, ICAM-1, and CD80; secreted low levels of proinflammatory cytokines; and exhibited reduced recognition by Chlamydia-specific CD4+ T cells. Adoptive transfer of live EB-pulsed DC was more effective than that of UV-EB-pulsed DC at protecting mice against challenge with live C. trachomatis. The expression of DC maturation markers and immune protection induced by UV-EB could be significantly enhanced by costimulation of DC ex vivo with UV-EB and oligodeoxynucleotides containing cytosine phosphate guanosine; however, the level of protection was significantly less than that achieved by using DC pulsed ex vivo with viable EBs. Thus, exposure of DC to live EBs results in a mature DC phenotype which is able to promote protective immunity, while exposure to UV-EB generates a semimature DC phenotype with less protective potential. This result may explain in part the differences in protective immunity induced by natural infection and immunization with whole inactivated organisms and is relevant to rational chlamydia vaccine design strategies.


Figures

FIG. 1.
FIG. 1.
Effect of live EBs and UV-EB on viability and phagocytic ability of DC. (A) DC were exposed to live EBs or UV-EB for 6 h at the indicated MOIs. Internalized bacteria were visualized by FACS after intracellular staining with antichlamydia FITC-labeled antibody. Results are given as the percentage of cells that were positive for both chlamydia and CD11c. (B) DC viability was determined by trypan blue exclusion and was calculated as the percentage of viable cells in the experimental group divided by the number of viable cells in the uninfected controls. Results represent the means ± standard deviations (SD) from four experiments. *, P < 0.05; **, P < 0.001.
FIG. 2.
FIG. 2.
Phenotypic and functional maturation of DC upon exposure to live EBs and UV-EB. (A) Allogeneic T-cell proliferation assays. DC from C57BL/6 mice were left untreated, incubated with LPS (1 μg/ml), or exposed to either live EBs or UV-EB for 48 h prior to irradiation. Irradiated DC were cocultured with purified BALB/c T cells for 48 h, and tritiated thymidine was added for an additional 24 h prior to harvesting and analysis for thymidine incorporation. Results represent the number of counts per minute (cpm) calculated per 100 DC. (B) Cytokine profiling. DC were untreated, incubated with LPS (1 μg/ml), or exposed to live EBs or UV-EB for 48 h before the supernatants were analyzed for cytokine production by ELISA. (C) IFN-γ production by Chlamydia-specific T cells. CD4+ T cells isolated from mice immunized against MoPn were cultured in isolation or cocultured with DC pulsed with either live EBs or UV-EB. Naïve DC and DC exposed to either live EBs or UV-EB were cultured in the absence of T cells to serve as DC negative controls. T cells isolated from naïve mice were either cultured alone or cocultured with DC pulsed with either live EBs or UV-EB and represent T-cell negative controls. Cells were incubated for 48 h, and the amount of IFN-γ secreted by T cells was determined by ELISA. All experiments were performed in triplicate and repeated on three separate occasions, with similar results. Results represent the mean ± SD from one representative experiment. *, P < 0.01; **, P < 0.001; ***, P < 0.01.
FIG. 2.
FIG. 2.
Phenotypic and functional maturation of DC upon exposure to live EBs and UV-EB. (A) Allogeneic T-cell proliferation assays. DC from C57BL/6 mice were left untreated, incubated with LPS (1 μg/ml), or exposed to either live EBs or UV-EB for 48 h prior to irradiation. Irradiated DC were cocultured with purified BALB/c T cells for 48 h, and tritiated thymidine was added for an additional 24 h prior to harvesting and analysis for thymidine incorporation. Results represent the number of counts per minute (cpm) calculated per 100 DC. (B) Cytokine profiling. DC were untreated, incubated with LPS (1 μg/ml), or exposed to live EBs or UV-EB for 48 h before the supernatants were analyzed for cytokine production by ELISA. (C) IFN-γ production by Chlamydia-specific T cells. CD4+ T cells isolated from mice immunized against MoPn were cultured in isolation or cocultured with DC pulsed with either live EBs or UV-EB. Naïve DC and DC exposed to either live EBs or UV-EB were cultured in the absence of T cells to serve as DC negative controls. T cells isolated from naïve mice were either cultured alone or cocultured with DC pulsed with either live EBs or UV-EB and represent T-cell negative controls. Cells were incubated for 48 h, and the amount of IFN-γ secreted by T cells was determined by ELISA. All experiments were performed in triplicate and repeated on three separate occasions, with similar results. Results represent the mean ± SD from one representative experiment. *, P < 0.01; **, P < 0.001; ***, P < 0.01.
FIG. 3.
FIG. 3.
Body weight loss and pulmonary bacterial load of mice immunized with live EB- or UV-EB-pulsed DC. DC were left untreated or incubated with either live EBs or UV-EB for a total of 48 h at 37°C. DC were washed with endotoxin-free PBS, and a total of 0.5 × 10⁶ DC were injected into the intraperitoneal cavities of mice, which were separated into experimental groups of five mice. Two groups of mice were immunized intraperitoneally with either 2 × 10⁵ live EBs or UV-EB as controls. Animals were boosted with an identical dose of DC or EBs on day 14 and finally challenged intranasally on day 21 with 3,000 IFU of live EBs. Immune protection was determined by daily measurement of body weight after the final challenge (A) and the determination of pulmonary IFU counts on day 8 postchallenge (B). All experiments were performed on three separate occasions, with similar results. Results represent the mean ± SD from one representative experiment. *, P < 0.001 (comparing live EB-pulsed DC and UV-EB-pulsed DC); **, P < 0.01; and ***, P < 0.001 (comparing live EBs and live EB-pulsed DC).
FIG. 4.
FIG. 4.
CpG induces maturation of UV-EB-pulsed DC. (A) Effect of CpG on the surface expression of CD40 and CD86. DC were left untreated or incubated with either UV-EB, UV-EB and CpG, or CpG alone. After 48 h, DC were stained for CD11c and either CD40 or CD86 and analyzed by FACS. Results shown are the percentage of CD11c+ cells expressing either CD40 or CD86. Results represent the mean ± SD from five independent experiments. (B) Allogeneic T-cell proliferation induced by DC upon exposure to UV-EB and CpG. Purified DC were left untreated or incubated with CpG (30 μg/ml), UV-EB alone, or UV-EB and CpG (30 μg/ml) and incubated for 48 h. Tritiated thymidine was added for an additional 24 h before cells were harvested and analyzed for thymidine incorporation. Experiments were performed on three separate occasions, with similar results. Results represent the mean ± SD from one experiment and show the number of cpm calculated per 100 DC. (C) Cytokine production by DC upon exposure to UV-EB and CpG. DC were left untreated or incubated with CpG (30 μg/ml), UV-EB, or UV-EB and CpG (30 μg/ml) for 48 h before the supernatants were analyzed for cytokine production by ELISA. Experiments were performed on three separate occasions, with similar results. Results represent the mean ± SD from one representative experiment. *, P < 0.01; **, P < 0.001 (both comparing UV-EB-pulsed DC and DC exposed to UV-EB and CpG).
FIG. 4.
FIG. 4.
CpG induces maturation of UV-EB-pulsed DC. (A) Effect of CpG on the surface expression of CD40 and CD86. DC were left untreated or incubated with either UV-EB, UV-EB and CpG, or CpG alone. After 48 h, DC were stained for CD11c and either CD40 or CD86 and analyzed by FACS. Results shown are the percentage of CD11c+ cells expressing either CD40 or CD86. Results represent the mean ± SD from five independent experiments. (B) Allogeneic T-cell proliferation induced by DC upon exposure to UV-EB and CpG. Purified DC were left untreated or incubated with CpG (30 μg/ml), UV-EB alone, or UV-EB and CpG (30 μg/ml) and incubated for 48 h. Tritiated thymidine was added for an additional 24 h before cells were harvested and analyzed for thymidine incorporation. Experiments were performed on three separate occasions, with similar results. Results represent the mean ± SD from one experiment and show the number of cpm calculated per 100 DC. (C) Cytokine production by DC upon exposure to UV-EB and CpG. DC were left untreated or incubated with CpG (30 μg/ml), UV-EB, or UV-EB and CpG (30 μg/ml) for 48 h before the supernatants were analyzed for cytokine production by ELISA. Experiments were performed on three separate occasions, with similar results. Results represent the mean ± SD from one representative experiment. *, P < 0.01; **, P < 0.001 (both comparing UV-EB-pulsed DC and DC exposed to UV-EB and CpG).
FIG. 5.
FIG. 5.
Body weight loss and pulmonary bacterial load of mice immunized with UV-EB- and CpG-pulsed DC. DC were left untreated or incubated with live EBs, UV-EB, CpG, or UV-EB and CpG for a total of 48 h at 37°C. DC were washed with endotoxin-free PBS, and a total of 0.5 × 10⁶ DC were injected into the intraperitoneal cavities of mice, which were separated into experimental groups of five mice. Animals were boosted with an identical dose of DC on day 14 and finally challenged intranasally on day 21 with 3,000 IFU of live EBs. Immune protection was determined by daily measurement of body weight after the final challenge (A) and the determination of pulmonary IFU counts on day 8 postchallenge (B). All experiments were performed on three separate occasions, with similar results. Results represent the mean ± SD from one representative experiment. *, P < 0.01; and **, P < 0.001 (both comparing UV-EB-pulsed DC and UV-EB- and CpG-pulsed DC).

Similar articles

Cited by

References

    1. Banchereau, J., and R. M. Steinman. 1998. Dendritic cells and the control of immunity. Nature 392:245-252. - PubMed
    1. Belland, R. J., G. Zhong, D. D. Crane, D. Hogan, D. Sturdevant, J. Sharma, W. L. Beatty, and H. D. Caldwell. 2003. Genomic transcriptional profiling of the developmental cycle of Chlamydia trachomatis. Proc. Natl. Acad. Sci. USA 100:8478-8483. - PMC - PubMed
    1. Birkelund, S., L. Bini, V. Pallini, M. Sanchez-Campillo, S. Liberatori, J. D. Clausen, S. Ostergaard, A. Holm, and G. Christiansen. 1997. Characterization of Chlamydia trachomatis l2-induced tyrosine-phosphorylated HeLa cell proteins by two-dimensional gel electrophoresis. Electrophoresis 18:563-567. - PubMed
    1. Brunham, R. C., J. Kimani, J. Bwayo, G. Maitha, I. Maclean, C. Yang, C. Shen, S. Roman, N. J. Nagelkerke, M. Cheang, and F. A. Plummer. 1996. The epidemiology of Chlamydia trachomatis within a sexually transmitted diseases core group. J. Infect. Dis. 173:950-956. - PubMed
    1. Brunham, R. C., D. J. Zhang, X. Yang, and G. M. McClarty. 2000. The potential for vaccine development against chlamydial infection and disease. J. Infect. Dis. 181(Suppl. 3):S538-S543. - PubMed

Publication types

MeSH terms

Substances