

Salmonella enterica Serovar Typhimurium infection of dendritic cells leads to functionally increased expression of the macrophage-derived chemokine
- PMID: 15731072
- PMCID: PMC1064904
- DOI: 10.1128/IAI.73.3.1714-1722.2005
Salmonella enterica Serovar Typhimurium infection of dendritic cells leads to functionally increased expression of the macrophage-derived chemokine
Abstract
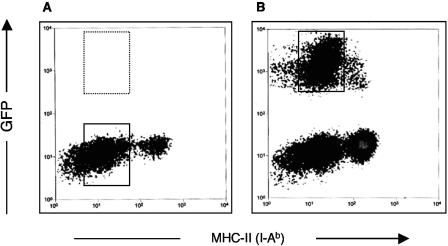
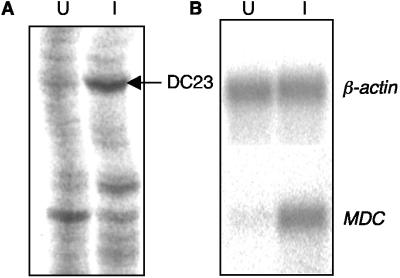
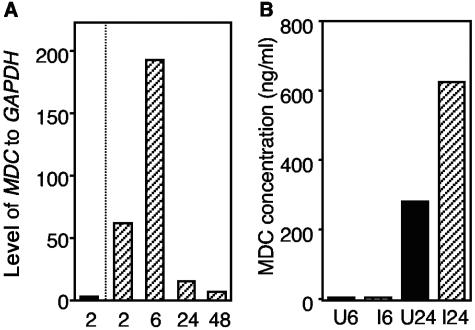
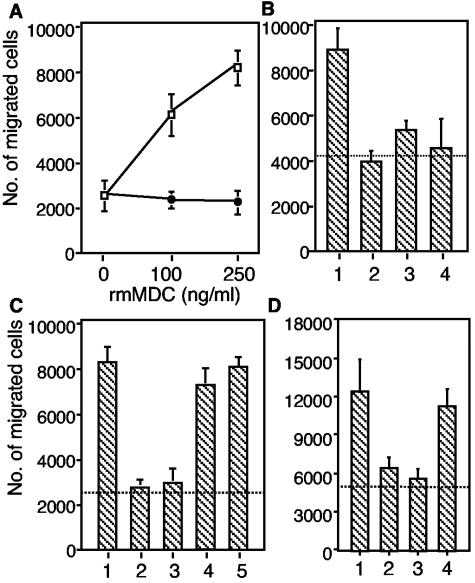
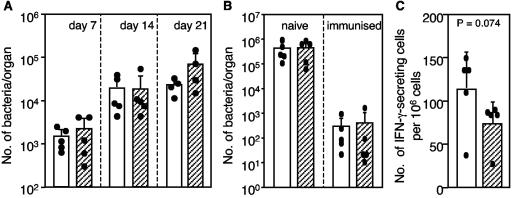
Gene expression in murine dendritic cells (DCs) infected with green fluorescent protein-expressing Salmonella enterica serovar Typhimurium BRD509 was studied by mRNA differential display. Infected DCs were sorted from uninfected cells by flow cytometry. The mRNA expression patterns of infected and uninfected cells revealed a number of differentially expressed transcripts, which included the macrophage-derived chemokine (MDC). Up-regulation of MDC transcription in infected DCs was confirmed by Northern blotting, and the kinetics of MDC expression was examined by real-time reverse transcription-PCR, with which 31- and 150-fold increases were detected at 2 and 6 h postinfection, respectively. The increased release by DCs of MDC into culture media was detected by an enzyme-linked immunosorbent assay. The biological activity of MDC was investigated in in vitro and in vivo assays. In vitro, supernatants from S. enterica serovar Typhimurium-infected DCs were chemoattractive to T cells, and neutralization of MDC in these supernatants inhibited T-cell migration. Passive transfer of anti-MDC antibody to mice infected with BRD509 revealed that neither growth of the bacterium nor resistance of the mice to reinfection was affected and that in vivo inhibition of MDC did not affect T-cell responses, as measured by the gamma interferon ELISPOT method 3 days after challenge infection.
Figures
Similar articles
-
Salmonella enterica serovar Typhimurium interaction with dendritic cells: impact of the sifA gene.Cell Microbiol. 2004 Nov;6(11):1071-84. doi: 10.1111/j.1462-5822.2004.00419.x. Cell Microbiol. 2004. PMID: 15469435
-
Effects of Salmonella enterica serovars Typhimurium (ST) and Choleraesuis (SC) on chemokine and cytokine expression in swine ileum and jejunal epithelial cells.Vet Immunol Immunopathol. 2006 Jun 15;111(3-4):199-209. doi: 10.1016/j.vetimm.2006.01.002. Epub 2006 Feb 13. Vet Immunol Immunopathol. 2006. PMID: 16473412
-
Expression of Toll-like receptors, interleukin 8, macrophage migration inhibitory factor, and osteopontin in tissues from pigs challenged with Salmonella enterica serovar Typhimurium or serovar Choleraesuis.Vet Immunol Immunopathol. 2007 Feb 15;115(3-4):309-19. doi: 10.1016/j.vetimm.2006.11.012. Epub 2006 Nov 25. Vet Immunol Immunopathol. 2007. PMID: 17178162
-
Regulation of macrophage-derived chemokine (MDC, CCL22) production.Crit Rev Immunol. 2002;22(2):105-14. Crit Rev Immunol. 2002. PMID: 12433129 Review.
-
Macrophage-derived chemokine (MDC).J Leukoc Biol. 2000 Sep;68(3):400-4. J Leukoc Biol. 2000. PMID: 10985257 Review.
Cited by
-
Single-Cell and Time-Resolved Profiling of Intracellular Salmonella Metabolism in Primary Human Cells.Anal Chem. 2019 Jun 18;91(12):7729-7737. doi: 10.1021/acs.analchem.9b01010. Epub 2019 May 31. Anal Chem. 2019. PMID: 31117406 Free PMC article.
-
Surface display of domain III of Japanese encephalitis virus E protein on Salmonella typhimurium by using an ice nucleation protein.Virol Sin. 2011 Dec;26(6):409-17. doi: 10.1007/s12250-011-3216-7. Epub 2011 Dec 10. Virol Sin. 2011. PMID: 22160941 Free PMC article.
-
Protein kinase C η is required for T cell activation and homeostatic proliferation.Sci Signal. 2011 Dec 6;4(202):ra84. doi: 10.1126/scisignal.2002058. Sci Signal. 2011. PMID: 22155788 Free PMC article.
-
The chemokine CCL2 is required for control of murine gastric Salmonella enterica infection.Infect Immun. 2005 Oct;73(10):6514-22. doi: 10.1128/IAI.73.10.6514-6522.2005. Infect Immun. 2005. PMID: 16177325 Free PMC article.
-
Dual RNA sequencing reveals dendritic cell reprogramming in response to typhoidal Salmonella invasion.Commun Biol. 2022 Feb 4;5(1):111. doi: 10.1038/s42003-022-03038-z. Commun Biol. 2022. PMID: 35121793 Free PMC article.
References
-
- Andrew, D. P., M. S. Chang, J. McNinch, S. T. Wathen, M. Rihanek, J. Tseng, J. P. Spellberg, and C. G. Elias, 3rd. 1998. STCP-1 (MDC) CC chemokine acts specifically on chronically activated Th2 lymphocytes and is produced by monocytes on stimulation with Th2 cytokines IL-4 and IL-13. J. Immunol. 161:5027-5038. - PubMed
-
- Banchereau, J., F. Briere, C. Caux, J. Davoust, S. Lebecque, Y. J. Liu, B. Pulendran, and K. Palucka. 2000. Immunobiology of dendritic cells. Annu. Rev. Immunol. 18:767-811. - PubMed
-
- Banchereau, J., and R. M. Steinman. 1998. Dendritic cells and the control of immunity. Nature 392:245-252. - PubMed
-
- Bonecchi, R., G. Bianchi, P. P. Bordignon, D. D'Ambrosio, R. Lang, A. Borsatti, S. Sozzani, P. Allavena, P. A. Gray, A. Mantovani, and F. Sinigaglia. 1998. Differential expression of chemokine receptors and chemotactic responsiveness of type 1 T helper cells (Th1s) and Th2s. J. Exp. Med. 187:129-134. - PMC - PubMed
-
- Bonecchi, R., S. Sozzani, J. T. Stine, W. Luini, G. D'Amico, P. Allavena, D. Chantry, and A. Mantovani. 1998. Divergent effects of interleukin-4 and interferon-gamma on macrophage-derived chemokine production: an amplification circuit of polarized T helper 2 responses. Blood 92:2668-2671. - PubMed
Publication types
MeSH terms
Substances
LinkOut - more resources
Full Text Sources
Molecular Biology Databases
