

Use of genome-wide expression profiling and mutagenesis to study the intestinal lifestyle of Campylobacter jejuni
- PMID: 15731081
- PMCID: PMC1064905
- DOI: 10.1128/IAI.73.3.1797-1810.2005
Use of genome-wide expression profiling and mutagenesis to study the intestinal lifestyle of Campylobacter jejuni
Abstract
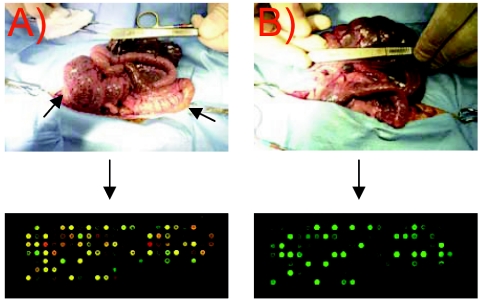
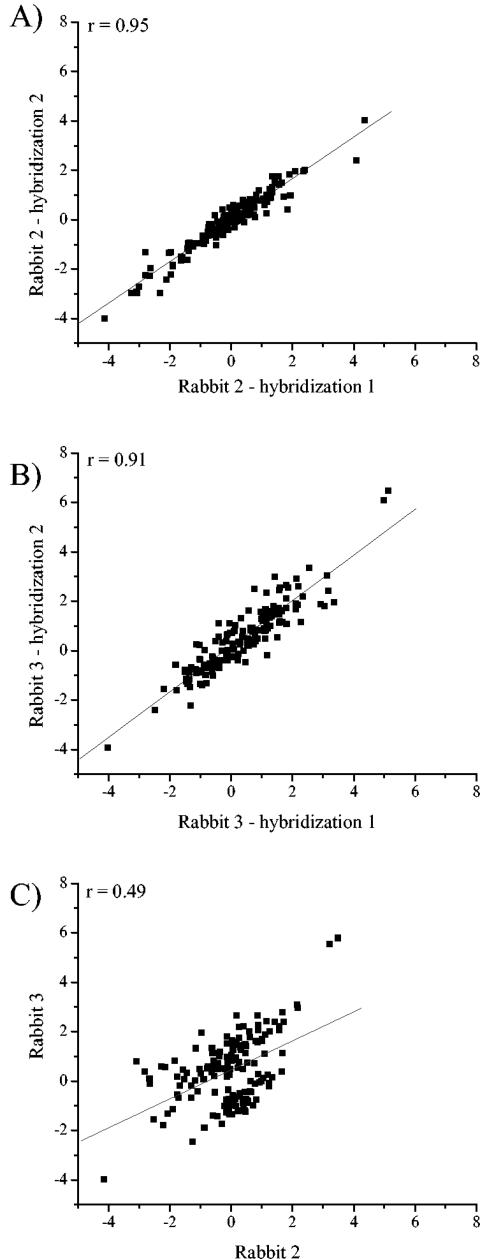
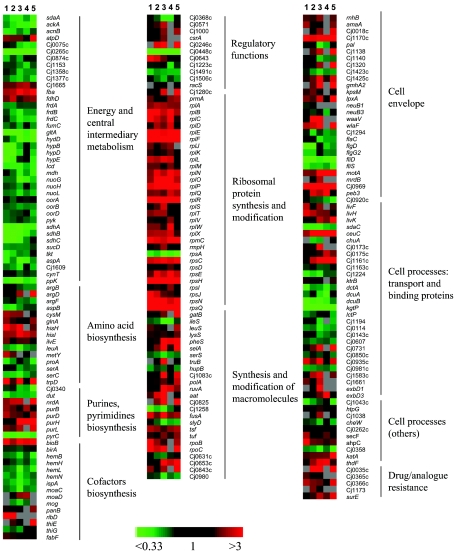
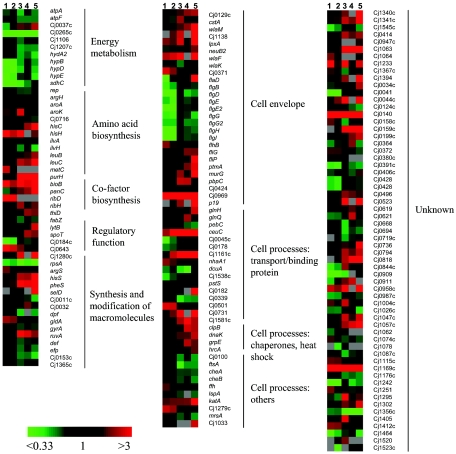
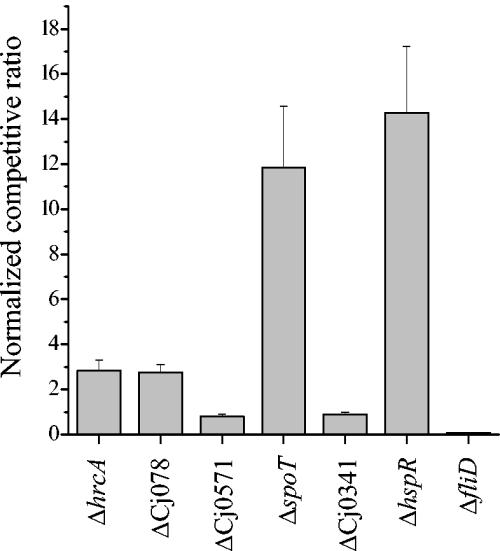
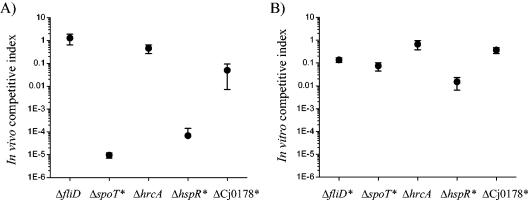
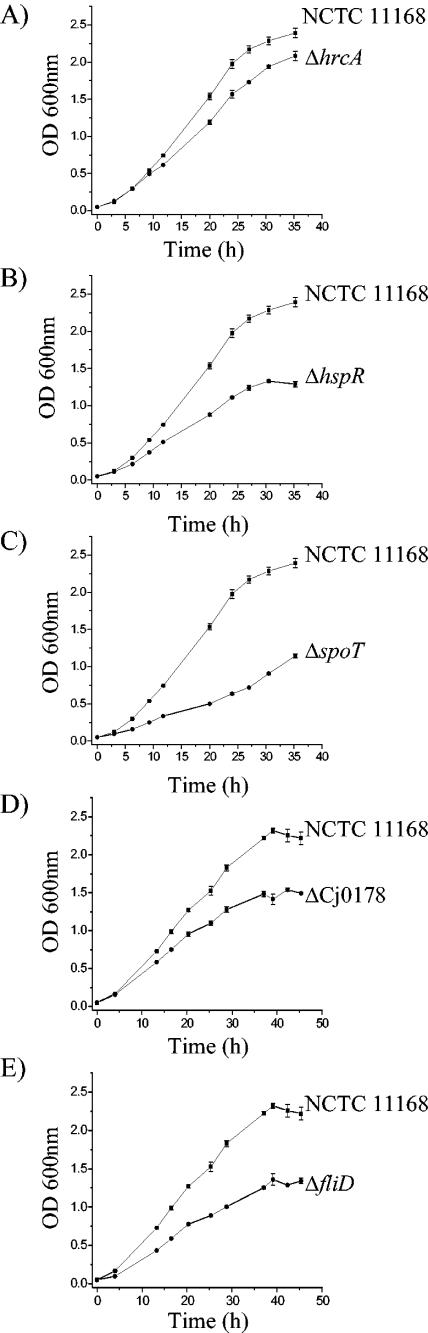
Campylobacter jejuni is the most common bacterial cause of diarrhea worldwide. To colonize the gut and cause infection, C. jejuni must successfully compete with endogenous microbes for nutrients, resist host defenses, persist in the intestine, and ultimately infect the host. These challenges require the expression of a battery of colonization and virulence determinants. In this study, the intestinal lifestyle of C. jejuni was studied using whole-genome microarray, mutagenesis, and a rabbit ileal loop model. Genes associated with a wide range of metabolic, morphological, and pathological processes were expressed in vivo. The in vivo transcriptome of C. jejuni reflected its oxygen-limited, nutrient-poor, and hyperosmotic environment. Strikingly, the expression of several C. jejuni genes was found to be highly variable between individual rabbits. In particular, differential gene expression suggested that C. jejuni extensively remodels its envelope in vivo by differentially expressing its membrane proteins and by modifying its peptidoglycan and glycosylation composition. Furthermore, mutational analysis of seven genes, hspR, hrcA, spoT, Cj0571, Cj0178, Cj0341, and fliD, revealed an important role for the stringent and heat shock response in gut colonization. Overall, this study provides new insights on the mechanisms of gut colonization, as well as possible strategies employed by Campylobacter to resist or evade the host immune responses.
Figures
Similar articles
-
Iron acquisition and regulation in Campylobacter jejuni.J Bacteriol. 2004 Jul;186(14):4714-29. doi: 10.1128/JB.186.14.4714-4729.2004. J Bacteriol. 2004. PMID: 15231804 Free PMC article.
-
Role of putative virulence traits of Campylobacter jejuni in regulating differential host immune responses.J Microbiol. 2019 Apr;57(4):298-309. doi: 10.1007/s12275-019-8165-0. Epub 2019 Feb 22. J Microbiol. 2019. PMID: 30796746
-
The Campylobacter jejuni stringent response controls specific stress survival and virulence-associated phenotypes.Mol Microbiol. 2005 Apr;56(1):8-27. doi: 10.1111/j.1365-2958.2005.04525.x. Mol Microbiol. 2005. PMID: 15773975
-
An overview of methods used to clarify pathogenesis mechanisms of Campylobacter jejuni.J Food Prot. 2010 Apr;73(4):786-802. doi: 10.4315/0362-028x-73.4.786. J Food Prot. 2010. PMID: 20377972 Review.
-
Defining the metabolic requirements for the growth and colonization capacity of Campylobacter jejuni.Front Cell Infect Microbiol. 2014 Sep 29;4:137. doi: 10.3389/fcimb.2014.00137. eCollection 2014. Front Cell Infect Microbiol. 2014. PMID: 25325018 Free PMC article. Review.
Cited by
-
Nutrient acquisition and metabolism by Campylobacter jejuni.Front Cell Infect Microbiol. 2012 Feb 7;2:5. doi: 10.3389/fcimb.2012.00005. eCollection 2012. Front Cell Infect Microbiol. 2012. PMID: 22919597 Free PMC article. Review.
-
Comparative transcriptional analysis of homologous pathogenic and non-pathogenic Lawsonia intracellularis isolates in infected porcine cells.PLoS One. 2012;7(10):e46708. doi: 10.1371/journal.pone.0046708. Epub 2012 Oct 3. PLoS One. 2012. PMID: 23056413 Free PMC article.
-
RNAseq Reveals Complex Response of Campylobacter jejuni to Ovine Bile and In vivo Gallbladder Environment.Front Microbiol. 2017 May 29;8:940. doi: 10.3389/fmicb.2017.00940. eCollection 2017. Front Microbiol. 2017. PMID: 28611744 Free PMC article.
-
Transcriptome analysis of Enterococcus faecalis during mammalian infection shows cells undergo adaptation and exist in a stringent response state.PLoS One. 2014 Dec 29;9(12):e115839. doi: 10.1371/journal.pone.0115839. eCollection 2014. PLoS One. 2014. PMID: 25545155 Free PMC article.
-
Epidemiology, relative invasive ability, molecular characterization, and competitive performance of Campylobacter jejuni strains in the chicken gut.Appl Environ Microbiol. 2007 Dec;73(24):7959-66. doi: 10.1128/AEM.01657-07. Epub 2007 Oct 5. Appl Environ Microbiol. 2007. PMID: 17921281 Free PMC article.
References
-
- Barker, M. M., T. Gaal, C. A. Josaitis, and R. L. Gourse. 2001. Mechanism of regulation of transcription initiation by ppGpp. I. Effects of ppGpp on transcription initiation in vivo and in vitro. J. Mol. Biol. 305:673-688. - PubMed
-
- Conway, T., and G. K. Schoolnik. 2003. Microarray expression profiling: capturing a genome-wide portrait of the transcriptome. Mol. Microbiol. 47:879-889. - PubMed
-
- Cotter, P. A., S. B. Melville, J. A. Albrecht, and R. P. Gunsalus. 1997. Aerobic regulation of cytochrome d oxidase (cydAB) operon expression in Escherichia coli: roles of Fnr and ArcA in repression and activation. Mol. Microbiol. 25:605-615. - PubMed
Publication types
MeSH terms
Substances
Grants and funding
LinkOut - more resources
Full Text Sources
Molecular Biology Databases
