. 2005 Mar;73(3):1811-9.
doi: 10.1128/IAI.73.3.1811-1819.2005.

Biofilm formation, icaADBC transcription, and polysaccharide intercellular adhesin synthesis by staphylococci in a device-related infection model

Affiliations

Biofilm formation, icaADBC transcription, and polysaccharide intercellular adhesin synthesis by staphylococci in a device-related infection model

Ursula Fluckiger et al. Infect Immun. 2005 Mar.

Abstract

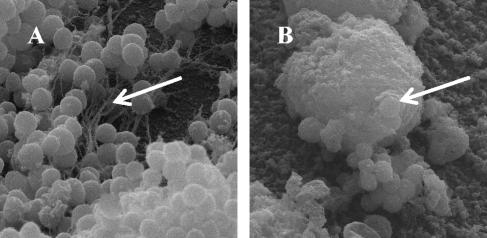
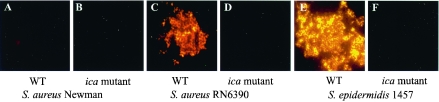
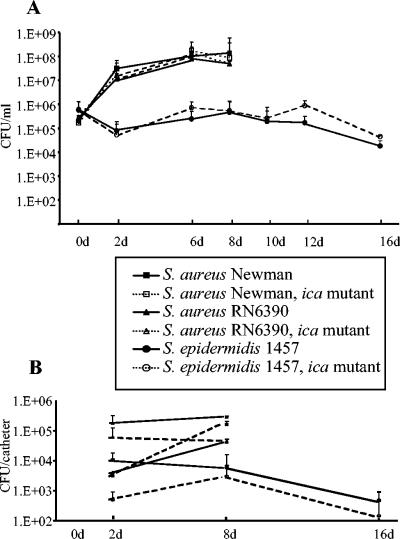
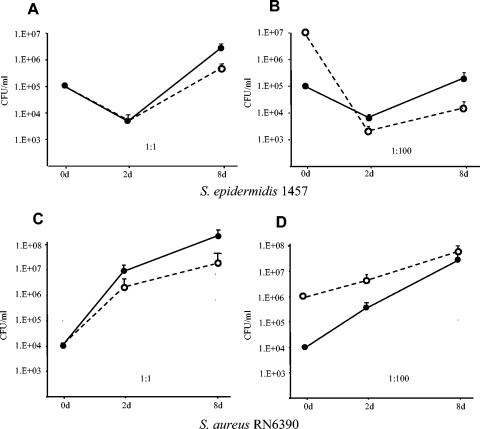
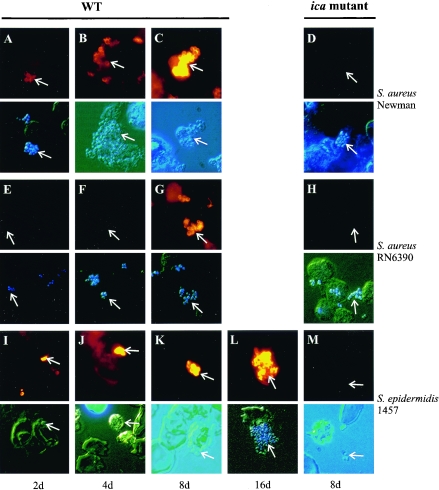
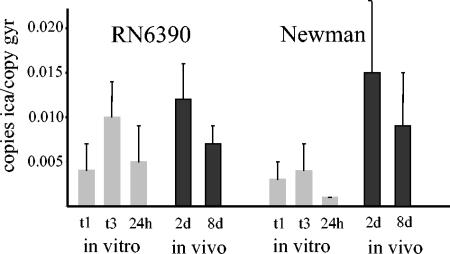
Biofilm formation of Staphylococcus epidermidis and S. aureus is mediated by the polysaccharide intercellular adhesin (PIA) encoded by the ica operon. We used a device-related animal model to investigate biofilm formation, PIA expression (immunofluorescence), and ica transcription (quantitative transcript analysis) throughout the course of infection by using two prototypic S. aureus strains and one S. epidermidis strain as well as corresponding ica mutants. During infection, the ica mutants were growth attenuated when inoculated in competition with the corresponding wild-type strains but not when grown singly. A typical biofilm was observed at the late course of infection. Only in S. aureus RN6390, not in S. aureus Newman, were PIA and ica-specific transcripts detectable after anaerobic growth in vitro. However, both S. aureus strains were PIA positive in vivo by day 8 of infection. ica transcription preceded PIA expression and biofilm formation in vivo. In S. epidermidis, both PIA and ica expression levels were elevated compared to those in the S. aureus strains in vitro as well as in vivo and were detectable throughout the course of infection. In conclusion, in S. aureus, PIA expression is dependent on the genetic background of the strain as well as on strong inducing conditions, such as those dominating in vivo. In S. epidermidis, PIA expression is elevated and less vulnerable to environmental conditions.


Figures

FIG. 1.
FIG. 1.
SEM micrographs of S. aureus RN6390 (A) and S. aureus Newman (B) adhering to catheter pieces explanted into tissue cages. Microcolonies (arrows) of staphylococci were found attached to the catheters. Engulfment of staphylococci by a phagocytic cell was observed (panel B, arrow). Original magnification, ×10,560.
FIG. 2.
FIG. 2.
S. aureus Newman, S. aureus RN6390, S. epidermidis 1457, and their ica mutants were grown anaerobically in chamber slides for 48 h. In panels A through F, culture broth was stained by indirect immunofluorescence to detect PIA. PIA was not detected in S. aureus strain Newman (panel A). In contrast, PIA was strongly marked by immunofluorescence in strain S. aureus RN6390 (panel C) and S. epidermidis 1457 (panel E) under anaerobic in vitro growth. All three ica mutants (panels B, D, and F) were PIA negative. WT, wild type. Original magnification, ×1,000.
FIG. 3.
FIG. 3.
In vivo growth curves of S. aureus RN6390, S. aureus Newman, S. epidermidis 1457, and their isogenic ica mutants in the guinea pig model. (A) Number of viable counts (CFU/ml) in exudates of tissue cages at the time of bacterial challenge at 0 days (0d), 2d, 6d, and 8d after S. aureus inoculation and 2d, 6d, 8d, 10d, 12d, and 16d after S. epidermidis inoculation. Each value is the mean ± standard deviation for six to eight cages from three or four independent experiments. (B) Number of bacteria attached to the catheters in the tissue cages at 2d and 8d after inoculation with S. aureus RN6390 or S. aureus Newman and additionally at 16d after S. epidermidis 1457 inoculation. Each value is the mean ± standard deviation for six to eight cages from three independent experiments.
FIG. 4.
FIG. 4.
In vivo growth curves of S. epidermidis 1457 (A and B) and S. aureus RN 6390 (C and D) and their respective ica mutants injected together into the tissue cages of mice at ratios of 1:1 (left panels) and 1:100 (right panels). Numbers of viable counts (CFU/ml) at the time point of infection, at day 2 (2d), and at 8d postinfection are shown. Solid lines represent the wild-type strains, and dotted lines represent the ica mutants. Data from three to eight mice from two experiments were pooled. At 2d, CFU counts of the ica-deficient S. aureus strains were lower than those of the wild-type strains, but this was not the case for S. epidermidis. At 8d, the ica mutants of both S. epidermidis and S. aureus reached significantly lower CFU counts than the corresponding wild-type strains (P < 0.05).
FIG. 5.
FIG. 5.
Micrographs of S. aureus strains RN6390 (A through C) and Newman (E through G) in exudates aspirated at day 2 (2d), 4d, and 8d; S. epidermidis 1457 (I through L) aspirated at 2d, 4d, 8d, and 16d; and their respective ica mutants (D, H, and M) aspirated at 8d from in vivo tissue cages. Bacteria were stained by indirect immunofluorescence for the detection of PIA (upper panels for each locant, arrows) and with DAPI to show the presence of all bacteria (lower panels for each locant). Immunofluorescence micrographs of exudates for the detection of PIA were negative at 2d and 4d after inoculation. However, both S. aureus strains were clearly positive at 8d (panels C, G, and K). Aspirated exudates from infected tissue cages with S. epidermidis were PIA positive already 2d after infection (panel I). Both species appeared in clusters at 8d (panels C, G, and L). The ica mutants of all three tested strains remained PIA negative (panels D, H, and M). WT, wild type. Original magnification, ×1,000.
FIG. 6.
FIG. 6.
Quantitative transcript analysis of S. aureus RN6390 and S. aureus Newman by LightCycler RT-PCR in vitro and in vivo. ica transcripts were quantified in relation to the number of gyr transcripts in each sample. Transcription of ica was determined in the mid-exponential phase (time 1 [t1]) and in the late-exponential phase (t3), as well as after 24 h of growth in CYPG (gray columns) and in exudates from infected devices in guinea pigs 2 days (2d) and 8d after bacterial inoculation (black columns). Values from three separate RNA preparations were used to calculate the mean values ± standard deviations.

Similar articles

Cited by

References

    1. Arciola, C. R., L. Baldassarri, and L. Montanaro. 2001. Presence of icaA and icaD genes and slime production in a collection of staphylococcal strains from catheter-associated infections. J. Clin. Microbiol. 39:2151-2156. - PMC - PubMed
    1. Cheung, A. L., J. M. Koomey, C. A. Butler, S. J. Projan, and V. A. Fischetti. 1992. Regulation of exoprotein expression in Staphylococcus aureus by a locus (sar) distinct from agr. Proc. Natl. Acad. Sci. USA 89:6462-6466. - PMC - PubMed
    1. Christensen, G. D., J. T. Parisi, A. L. Bisno, W. A. Simpson, and E. H. Beachey. 1983. Characterization of clinically significant strains of coagulase-negative staphylococci. J. Clin. Microbiol. 18:258-269. - PMC - PubMed
    1. Christensen, G. D., W. A. Simpson, A. L. Bisno, and E. H. Beachey. 1982. Adherence of slime-producing strains of Staphylococcus epidermidis to smooth surfaces. Infect. Immun. 37:318-326. - PMC - PubMed
    1. Christensen, G. D., W. A. Simpson, J. J. Younger, L. M. Baddour, F. F. Barrett, D. M. Melton, and E. H. Beachey. 1985. Adherence of coagulase-negative staphylococci to plastic tissue culture plates: a quantitative model for the adherence of staphylococci to medical devices. J. Clin. Microbiol. 22:996-1006. - PMC - PubMed

Publication types

MeSH terms

Substances

LinkOut - more resources