. 2005 Feb 24;33(4):1169-81.
doi: 10.1093/nar/gki251. Print 2005.

Translation of the first upstream ORF in the hepatitis B virus pregenomic RNA modulates translation at the core and polymerase initiation codons

Affiliations

Translation of the first upstream ORF in the hepatitis B virus pregenomic RNA modulates translation at the core and polymerase initiation codons

Augustine Chen et al. Nucleic Acids Res. .

Abstract

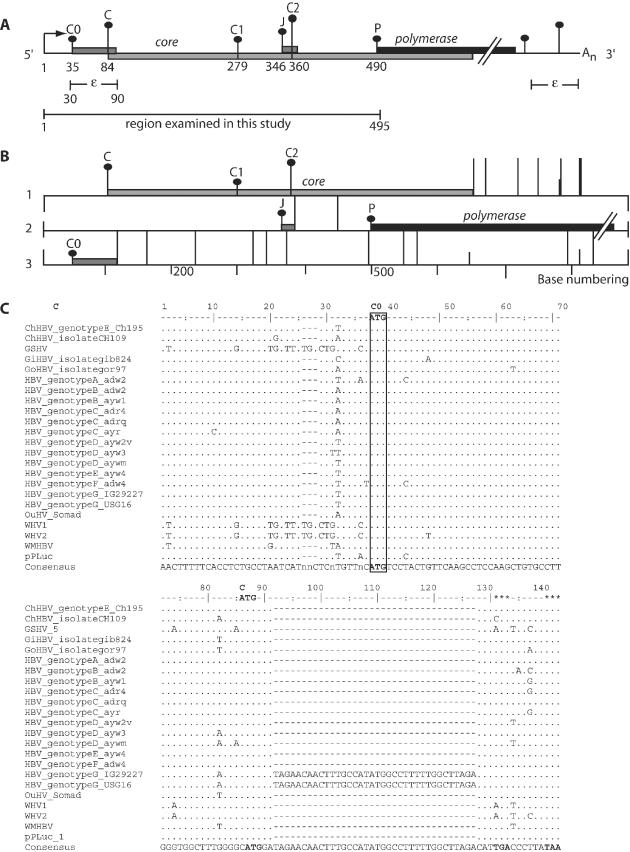
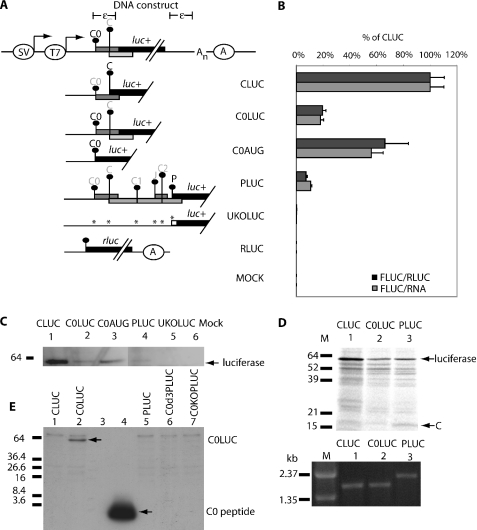
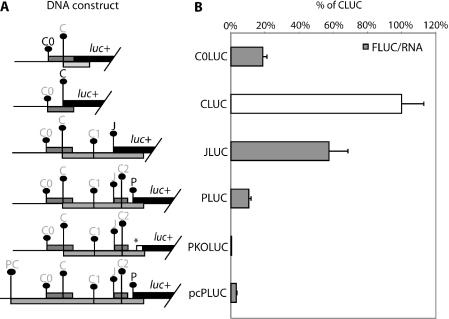
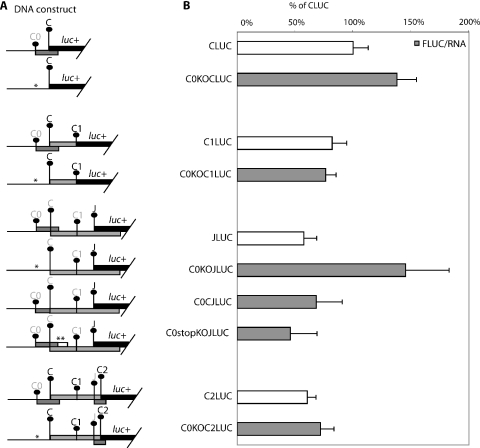
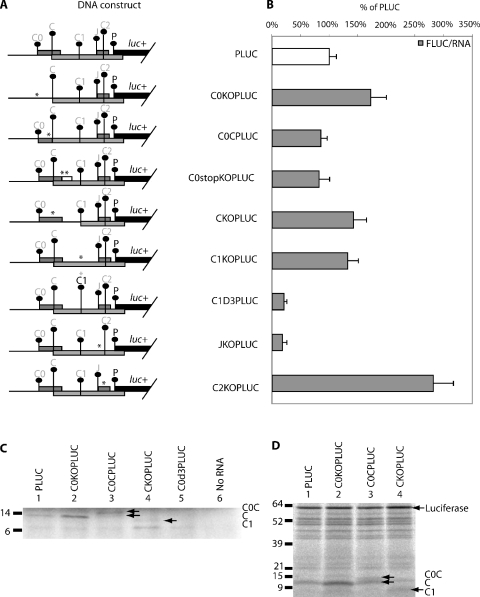
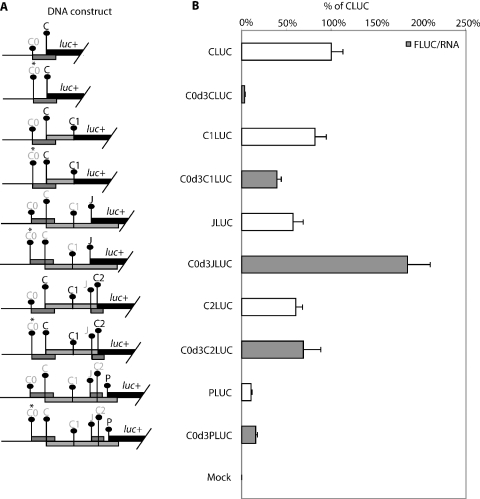
The human hepatitis B virus (HBV) has a compact genome encoding four major overlapping coding regions: the core, polymerase, surface and X. The polymerase initiation codon is preceded by the partially overlapping core and four or more upstream initiation codons. There is evidence that several mechanisms are used to enable the synthesis of the polymerase protein, including leaky scanning and ribosome reinitiation. We have examined the first AUG in the pregenomic RNA, it precedes that of the core. It initiates an uncharacterized short upstream open reading frame (uORF), highly conserved in all HBV subtypes, we designated the C0 ORF. This arrangement suggested that expression of the core and polymerase may be affected by this uORF. Initiation at the C0 ORF was confirmed in reporter constructs in transfected cells. The C0 ORF had an inhibitory role in downstream expression from the core initiation site in HepG2 cells and in vitro, but also stimulated reinitiation at the polymerase start when in an optimal context. Our results indicate that the C0 ORF is a determinant in balancing the synthesis of the core and polymerase proteins.


Figures

Figure 1
Figure 1
The conservation of the C0 ORF in all HBV genotypes and other members of the orthohepadnaviridae. (A) Schematic representation of the HBV pregenomic RNA transcript. The numbering in the scheme is such that nucleotide 1 is the pgRNA start site, indicated by the arrow (this number corresponds to nucleotide number 1816 in the ayw subtype). The pgRNA contains an epsilon structure, near the 5′ and 3′ end of the RNA. This transcript also contains a redundant sequence of 117 bases in its 3′ end, found in the 5′ end of the transcript. Vertical bars with dots represent the initiation codons within the pgRNA labeled C0, C, C1, J, C2 and P. The height of each vertical bar with black dots represents the match to the ‘ideal’ initiation context of Kozak's consensus. ORFs encoded by each initiation codon are represented by filled boxes while the poly(A) tail is denoted by An. (B) Schematic representation of the three different ORFs in the pgRNA in which the C0, C, J and P protein are made. The initiation codons (vertical bars with black dots) and termination codons (long vertical bars without dots) are marked in each of the three possible reading frames with the corresponding ORFs represented by filled boxes. (C) The comparison of DNA sequences in the region of the C0 ORF from representative members of the orthohepadnaviruses. The alignment of these sequences revealed a well-conserved ‘weak’ initiation codon (C0) and its 19 amino acid ORF which overlaps the C ORF by 8 bases.
Figure 2
Figure 2
Translation initiation from the C0 initiation codon compared with that from C and P initiation codons. (A) Schematic representation of the DNA constructs used in this study (diagram not to scale). It contains the SV40 and T7 promoter at the 5′ end followed by DNA sequences corresponding to the HBV pregenomic RNA leader fused to the luciferase gene. The nucleotide sequence for the hepatitis B virus pregenomic RNA leader has been deposited in the DNA Data Bank of Japan under DDBJ accession no. AB037684. Immediately downstream of the luciferase gene is the 117 bases of repeated sequence to mimic the terminally redundant pgRNA which also contains the epsilon structure denoted by ε. At the 3′ end, An denotes the poly(A) tract while the SV40 poly(A) signal is denoted by an enclosed A. Vertical bars with dots represent the initiation codons within the pgRNA labeled C0, C in a light and dark font. The darker font represents the initiation codon that is in-frame to the luciferase reporter gene. ORFs encoded by each initiation codon are represented by filled boxes. Any mutation introduced into the leader sequence is denoted with an asterisk (*). Other labels are as in Figure 1. (B) Normalized expression level from the C0, C and P initiation codons after transfection into HepG2 cells. Expression from each initiation codon is expressed as a percentage of normalized CLUC expression. These results are averages of three replicates from two independent experiments. (C) Luciferase expression was confirmed via western blot using anti-luciferase antibody on HepG2 transfected lysates separated on 5–20% SDS–PAGE. (D) Fluorograph of the luciferase fusion proteins translated off capped transcript in rabbit reticulocyte. Proteins were separated on 5–20% SDS–PAGE. Lane 1, CLUC RNA; lane 2, C0LUC RNA; lane 3, PLUC RNA; M, protein or DNA marker. The integrity and quantitation of the capped RNA used for cell-free translation is shown on the RNA gel below. (E) Detection of the C0LUC fusion protein in HepG2 transfected lysates via immunoblot analysis using anti-C0 antibody. Lane 4 contains 50 ng of synthetic C0.
Figure 3
Figure 3
The expression levels from each respective initiation codon within the HBV pregenomic RNA. (A) A schematic diagram of the HBV test constructs used to study the levels of initiation from C0, C, J and P initiation codons. Each initiation codon is fused in-frame to the luciferase gene. The initiation codon with a darker font is in-frame to the luciferase reporter gene and an asterisk (*) indicates the position where a mutation is introduced. (B) Normalized expression level from each initiation codon as compared with that from CLUC, assigned as 100%. These results are averages from two independent experiments.
Figure 4
Figure 4
The effect of C0 initiation codon removal on expression at downstream initiation. (A) Schematic diagram of the HBV test constructs used to study the effect of C0 on downstream expression. The initiation codon with a darker font is in-frame to the luciferase reporter gene and an asterisk (*) indicates the position where a mutation is introduced. (B) Result of DNA transfection of the above constructs into HepG2 cells. The normalized luciferase activity of each construct with C0 mutation is compared with its respective parent construct without the C0 mutation. Normalized expression levels are presented as a percentage of the CLUC construct, assigned 100%. These results are averages of replicates from two independent experiments. Results from the C, C1 and C2 series represent sums of the activities of fusion proteins with similar specific activities.
Figure 5
Figure 5
The effect of upstream AUG mutations on the expression at P initiation codon. (A) Schematic diagram of the HBV test constructs used to study the effect of upstream mutation on P expression. The initiation codon with a darker font is in-frame to the luciferase reporter gene and an asterisk (*) indicates the position where a mutation is introduced. (B) Result of DNA transfection of the above constructs into HepG2 cells. The normalized luciferase activity of each construct with upstream mutations is compared with the parent PLUC construct. Average luciferase counts for PLUC were 12 545 ± 141 RLU (relative light unit) in 103 HepG2 cells, which were normalized against respective RNA levels as determined by real-time PCR. These results are averages of two replicates from two independent experiments. (C) Fluorograph of the proteins translated in wheat germ extract in the presence of [35S]methionine from representative in vitro synthesized cap RNA. Proteins were separated on a 5–20% SDS–polyacrylamide gel. (D) Fluorograph of the proteins translated in rabbit reticulocyte lysate. Proteins were separated on a 5–20% SDS–polyacrylamide gel.
Figure 6
Figure 6
The effect of an optimal C0 initiation context on the expression at downstream initiation. (A) Schematic diagram of the HBV test constructs used to study the effect of an optimal C0 initiation context. The initiation codon with a darker font is in-frame to the luciferase reporter gene while an asterisk (*) indicates the position where a mutation is introduced. (B) Result of DNA transfection of the above constructs into HepG2 cells. The normalized luciferase activity of each construct with the improved C0 initiation context is compared with their corresponding counterpart without C0 context enhancement. Normalized expression levels are presented as a percentage of the CLUC construct, assigned 100%. These results are averages of two replicates from two independent experiments.

Similar articles

Cited by

References

    1. Seeger C., Mason W.S. Hepatitis B virus biology. Microbiol. Mol. Biol. Rev. 2000;64:51–68. - PMC - PubMed
    1. Chin R., Locarnini S. Treatment of chronic hepatitis B: current challenges and future directions. Rev. Med. Virol. 2003;13:255–272. - PubMed
    1. Feld J., Lee J.Y., Locarnini S. New targets and possible new therapeutic approaches in the chemotherapy of chronic hepatitis B. Hepatology. 2003;38:545–553. - PubMed
    1. Ganem D., Varmus H.E. The molecular biology of the hepatitis B viruses. Annu. Rev. Biochem. 1987;56:651–693. - PubMed
    1. Ou J.H., Bao H., Shih C., Tahara S.M. Preferred translation of human hepatitis B virus polymerase from core protein- but not from precore protein-specific transcript. J. Virol. 1990;64:4578–4581. - PMC - PubMed

Publication types