Comparative Study
. 2005 Feb;169(2):863-80.
doi: 10.1534/genetics.104.027300.

Effect of teosinte cytoplasmic genomes on maize phenotype

Affiliations
Comparative Study

Effect of teosinte cytoplasmic genomes on maize phenotype

James O Allen. Genetics. 2005 Feb.

Abstract

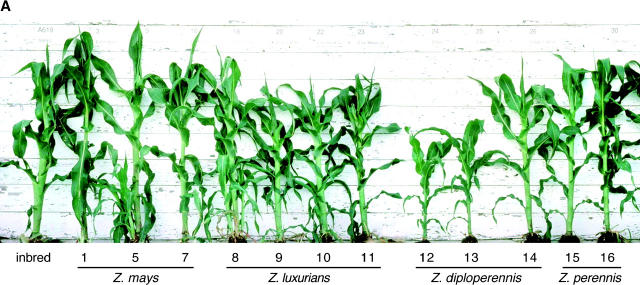
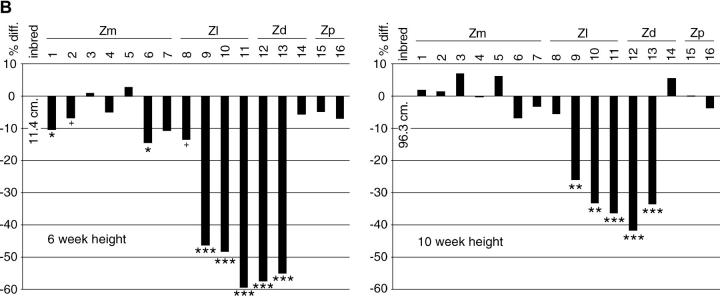
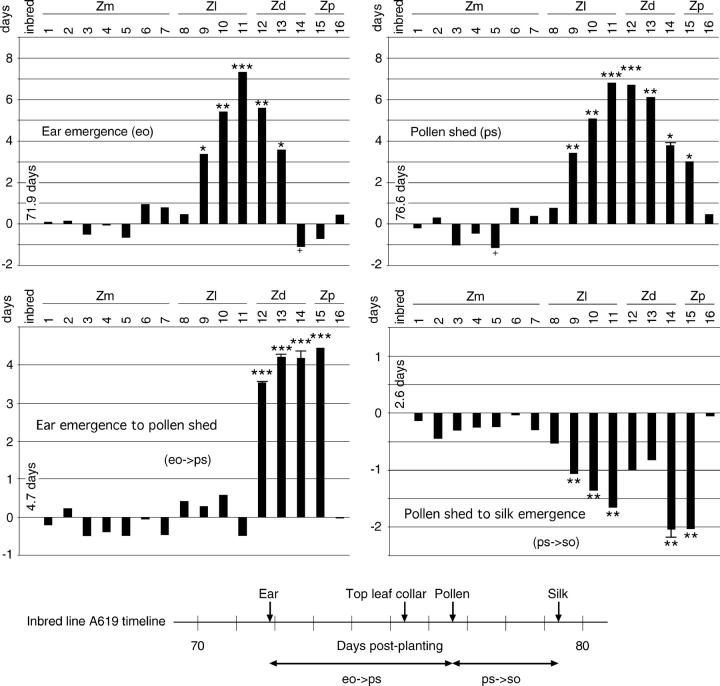
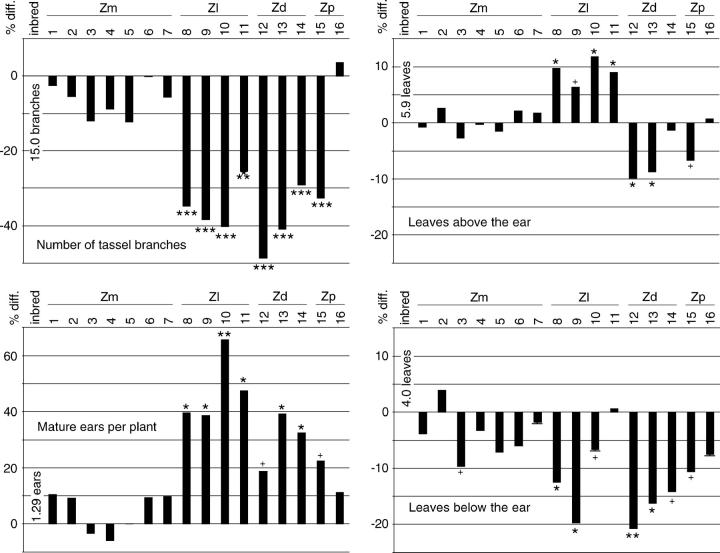
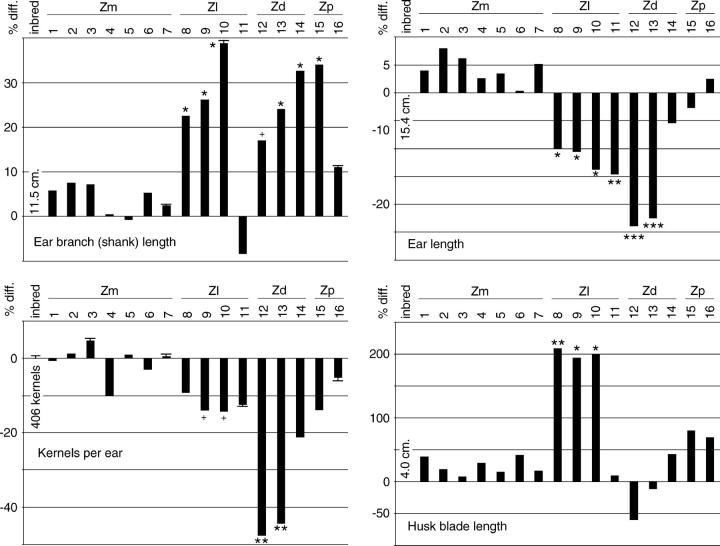
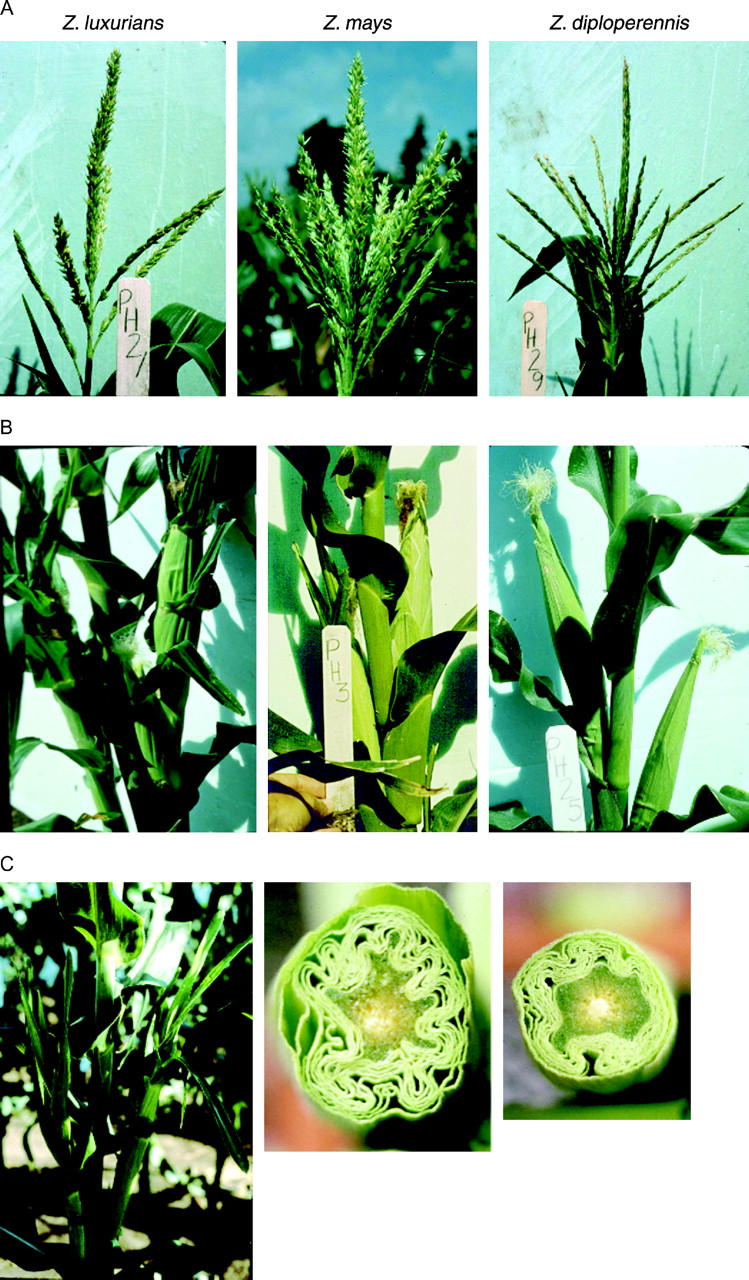
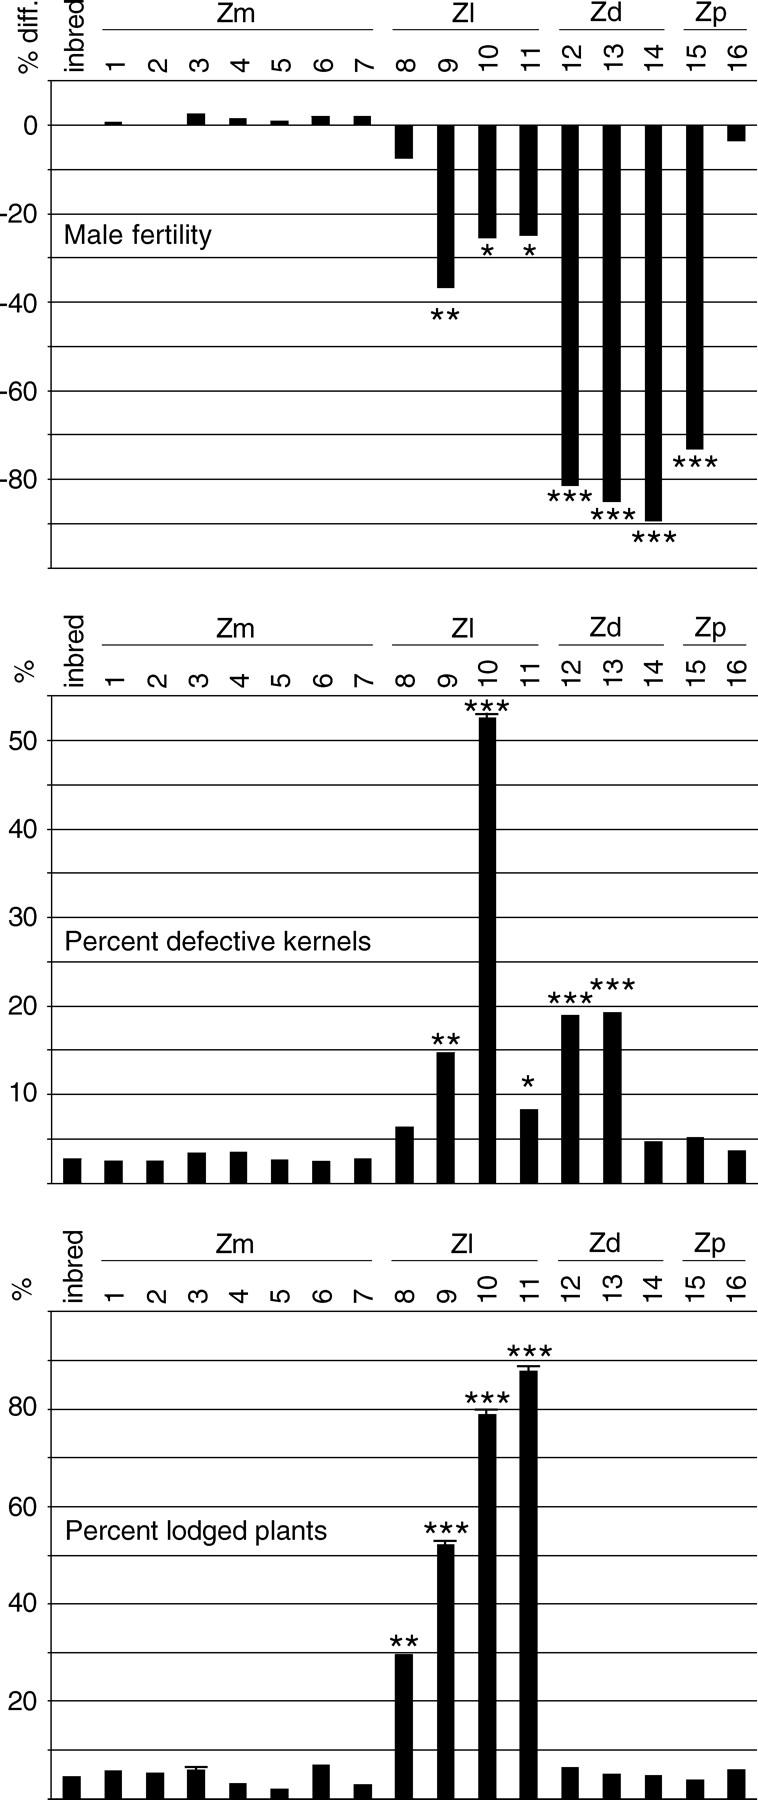
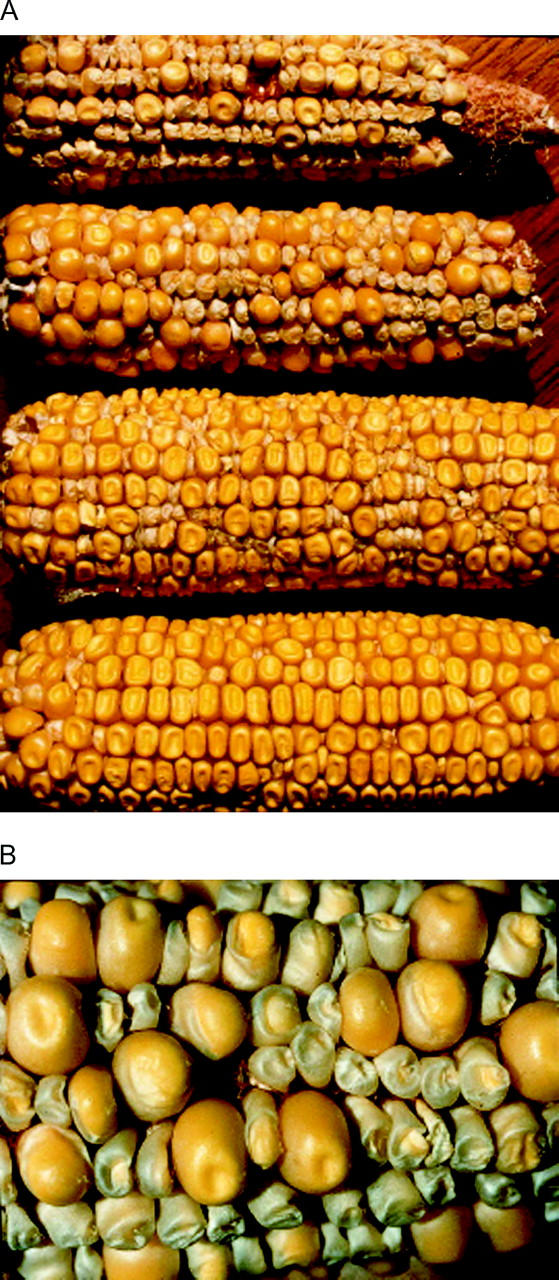
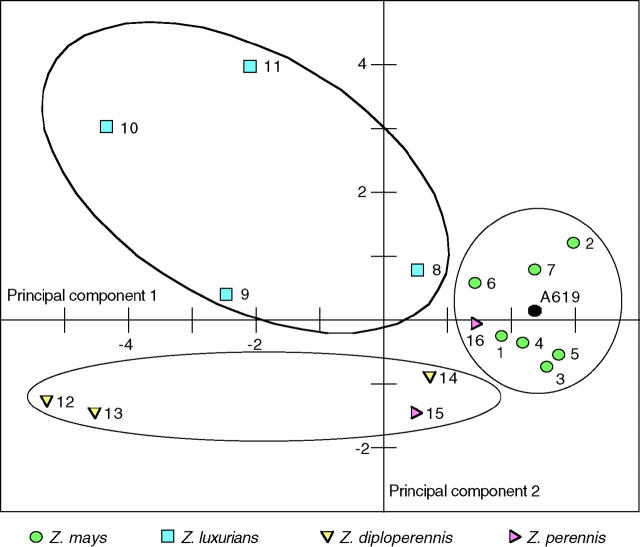
Determining the contribution of organelle genes to plant phenotype is hampered by several factors, including the paucity of variation in the plastid and mitochondrial genomes. To circumvent this problem, evolutionary divergence between maize (Zea mays ssp. mays) and the teosintes, its closest relatives, was utilized as a source of cytoplasmic genetic variation. Maize lines in which the maize organelle genomes were replaced through serial backcrossing by those representing the entire genus, yielding alloplasmic sublines, or cytolines were created. To avoid the confounding effects of segregating nuclear alleles, an inbred maize line was utilized. Cytolines with Z. mays teosinte cytoplasms were generally indistinguishable from maize. However, cytolines with cytoplasm from the more distantly related Z. luxurians, Z. diploperennis, or Z. perennis exhibited a plethora of differences in growth, development, morphology, and function. Significant differences were observed for 56 of the 58 characters studied. Each cytoline was significantly different from the inbred line for most characters. For a given character, variation was often greater among cytolines having cytoplasms from the same species than among those from different species. The characters differed largely independently of each other. These results suggest that the cytoplasm contributes significantly to a large proportion of plant traits and that many of the organelle genes are phenotypically important.


Figures

F<sc>igure</sc> 1.—
Figure 1.—
Experimental design. Plants grown from teosinte seeds were pollinated with maize pollen. The resulting seeds were grown, and the hybrid plants were also pollinated with maize pollen. Continued backcrossing always used the plant tracing back to teosinte as female, ensuring that the progeny had teosinte cytoplasm. Thus, for each cytoline, all plants in the lineage trace back ultimately to a single teosinte seed. Twelve seeds from each plant in the penultimate generation were used to produce families of 10 progeny for observation (only plant-six pedigree is shown), except that for those cytotypes showing substantially elevated defective kernel proportions (cytotypes 8–13; see results), 10 sixth-backcross families were grown. The first five plants in each seventh-generation family were manually backcrossed to obtain ear and kernel data.
F<sc>igure</sc> 2.—
Figure 2.—
Relevant parts of the maize plant. Both illustrations show the plant shortly after silk emergence. The plant's morphology changes little after that point, with the exception of substantial growth of the ear and its associated structures, such as the husk. The first six leaf nodes are underground and below the roots illustrated.
F<sc>igure</sc> 3.—
Figure 3.—
Plant height. (A) Plants at 10 weeks postplanting. These plants were grown expressly for photographic purposes and thus the heights do not necessarily match the data in the 10-week height graph. Numbers indicate cytotypes (see Table 2). (B) Average plant heights at 6 and 10 weeks postplanting. Data are shown as the proportional difference from the reference inbred line (A619). The actual value for the inbred line is given under “inbred line” on the chart. There is much-reduced growth in most Z. luxurians and Z. diploperennis cytotypes, but not in Z. perennis and Z. mays cytotypes. The scale is the same for both graphs. Standard errors are too small to be seen in the figure. Cytotypes are labeled below their cytoplasm donor species; Zm, Z. mays; Zl, Z. luxurians; Zd, Z. diplolperennis; Zp, Z. perennis. Statistical significance is indicated as appropriate (***ρ < 0.0001, **ρ < 0.001, *ρ < 0.01, +ρ < 0.02).
F<sc>igure</sc> 4.—
Figure 4.—
Difference from the inbred line to two developmental milestones in two times separating developmental milestones (in days). The developmental time line for the reference inbred line is shown at the bottom. Scales are not all the same. Standard error bars are included where they are large enough to be seen. See Figure 3 for general information.
F<sc>igure</sc> 5.—
Figure 5.—
Proportional difference from the inbred line in numbers of plant parts. “Number of tassel branches” includes only primary tassel branches. “Mature ears per plant” is equivalent to “branches per mature plant,” since each branch had an ear. Scales are the same for both leaf graphs. See Figure 3 for general information.
F<sc>igure</sc> 6.—
Figure 6.—
Proportional difference from the inbred line in sizes of plant parts and in kernels per ear. Scales are all different. See Figure 3 for general information.
F<sc>igure</sc> 7.—
Figure 7.—
Reproductive-structure morphology. Phenotypes were consistent within a taxon, with the exception of cytotype 11 (see Table 4). (A) Tassels 2 days after the onset of pollen shed, except for Z. diploperennis, which never shed pollen. Sterile branches are thin because anthers have not exserted. (B) Ears the day after the onset of silk emergence. Z. diploperennis and Z. luxurians ear branches are longer than Z. mays ear branches and are angled away from the stalk. Z. diploperennis husks are pointedly conical with virtually no blades. Z. luxurians husks are cylindrical with long blades that hide the silks from view. Z. mays plant is unusual in having two fully developed ears, whereas the other two cytotypes are typical in having at least that many. (C) Example of very long husk blades (flag leaves). Cross section of ears showing tight packing of Z. diploperennis husks. Both ears were cut at the very tip of the cob, seen as white at the center of each ear. Contemporary photo of Z. luxurians ear was not taken.
F<sc>igure</sc> 8.—
Figure 8.—
Male fertility, kernel defects, and plant lodging. Fertility was determined as a function of pollen quantity and is shown as the proportional difference from the reference inbred line. Z. diploperennis and Z. perennis cytoplasms had a severe effect on male fertility but essentially none on resistance to lodging, while the reverse was true for Z. luxurians cytoplasm. “Percent defective kernels” is the sum of the proportion of mildly defective and severely defective kernels (see Table 3). See Figure 3 for general information.
F<sc>igure</sc> 9.—
Figure 9.—
Defective endosperm production. (A) Severely and mildly affected ears from Z. luxurians cytotype 10 (upper two ears) and from cytotype 9. Only about a dozen normal kernels are visible on the top ear. (B) Close-up of mildly affected cytotype 10 ear.
F<sc>igure</sc> 10.—
Figure 10.—
Plot of the first two principal components in analyses of non-auto-correlated characters by cytotype. Principal components 1 and 2 accounted for 37 and 20% of the variance, respectively. Cytoplasm species clusters are circled. Z. mays cytotypes form a tight, discrete group with the inbred line at its approximate center. Cytotypes from Z. luxurians and from the perennial teosintes form another two dispersed but discrete groups.

References

    1. Allen, J. O., 1992 Teosinte cytoplasmic genomes: interaction with maize nuclear genomes and molecular genetic characterization of the mitochondria. Ph.D. Thesis, University of Wisconsin, Madison, WI.
    1. Allen, J. O., G. K. Emenhiser and J. L. Kermicle, 1989. Miniature kernel and plant: interaction between teosinte cytoplasmic genomes and maize nuclear genomes. Maydica 34: 277–290.
    1. Beadle, G. W., 1980. The ancestry of corn. Sci. Am. 242: 112–119.
    1. Belliard, G., F. Vedel and G. Pelletier, 1979. Mitochondrial recombination in cytoplasmic hybrids of Nicotiana tabacum by protoplast fusion. Nature 281: 401–403.
    1. Benz, B. F., L. R. Sanchez-Velasquez and F. J. Santana Michel, 1990. Ecology and ethnobotany of Zea diploperennis: preliminary investigations. Maydica 35: 85–98.

Publication types