

Coupling of the cortical hemodynamic response to cortical and thalamic neuronal activity
- PMID: 15734797
- PMCID: PMC550644
- DOI: 10.1073/pnas.0407789102
Coupling of the cortical hemodynamic response to cortical and thalamic neuronal activity
Abstract
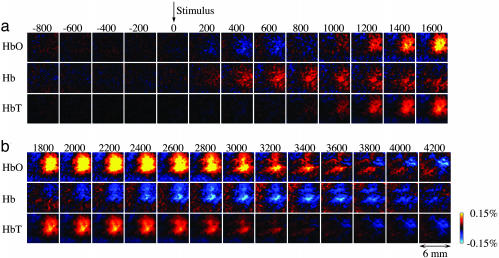
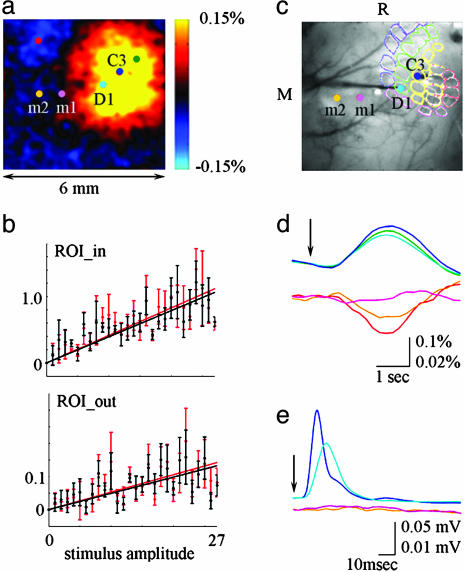
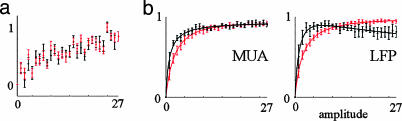
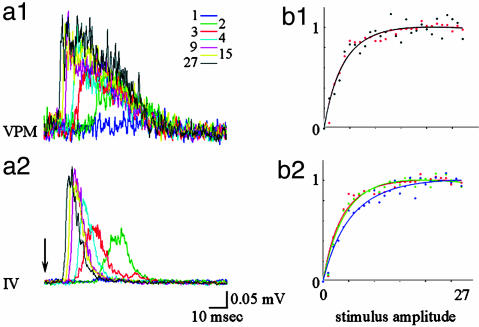
Accurate interpretation of functional MRI (fMRI) signals requires knowledge of the relationship between the hemodynamic response and the neuronal activity that underlies it. Here we address the question of coupling between pre- and postsynaptic neuronal activity and the hemodynamic response in rodent somatosensory (Barrel) cortex in response to single-whisker deflection. Using full-field multiwavelength optical imaging of hemoglobin oxygenation and electrophysiological recordings of spiking activity and local field potentials, we demonstrate that a point hemodynamic measure is influenced by neuronal activity across multiple cortical columns. We demonstrate that the hemodynamic response is a spatiotemporal convolution of the neuronal activation. Therefore, positive hemodynamic response in one cortical column might be explained by neuronal activity not only in that column but also in the neighboring columns. Thus, attempts at characterizing the neurovascular relationship based on point measurements of electrophysiology and hemodynamics may yield inconsistent results, depending on the spatial extent of neuronal activation. The finding that the hemodynamic signal observed at a given location is a function of electrophysiological activity over a broad spatial region helps explain a previously observed increase of local vascular response beyond the saturation of local neuronal activity. We also demonstrate that the oxy- and total-hemoglobin hemodynamic responses can be well approximated by space-time separable functions with an antagonistic center-surround spatial pattern extending over several millimeters. The surround "negative" hemodynamic activity did not correspond to observable changes in neuronal activity. The complex spatial integration of the hemodynamic response should be considered when interpreting fMRI data.
Figures
Similar articles
-
Spatial extent of oxygen metabolism and hemodynamic changes during functional activation of the rat somatosensory cortex.Neuroimage. 2005 Aug 15;27(2):279-90. doi: 10.1016/j.neuroimage.2005.04.024. Neuroimage. 2005. PMID: 15925522
-
Fine detail of neurovascular coupling revealed by spatiotemporal analysis of the hemodynamic response to single whisker stimulation in rat barrel cortex.J Neurophysiol. 2008 Feb;99(2):787-98. doi: 10.1152/jn.00658.2007. Epub 2007 Nov 28. J Neurophysiol. 2008. PMID: 18046008 Free PMC article.
-
Decreased haemodynamic response and decoupling of cortical gamma-band activity and tissue oxygen perfusion after striatal interleukin-1 injection.J Neuroinflammation. 2016 Aug 24;13(1):195. doi: 10.1186/s12974-016-0664-x. J Neuroinflammation. 2016. PMID: 27557843 Free PMC article.
-
Laminar fMRI: What can the time domain tell us?Neuroimage. 2019 Aug 15;197:761-771. doi: 10.1016/j.neuroimage.2017.07.040. Epub 2017 Jul 20. Neuroimage. 2019. PMID: 28736308 Free PMC article. Review.
-
Human brain mapping: hemodynamic response and electrophysiology.Clin Neurophysiol. 2008 Apr;119(4):731-43. doi: 10.1016/j.clinph.2007.10.026. Epub 2008 Jan 9. Clin Neurophysiol. 2008. PMID: 18187361 Review.
Cited by
-
Contrasting dose-dependent effects of acute intravenous methamphetamine on lateral hypothalamic extracellular glucose dynamics in male and female rats.J Neurophysiol. 2022 Oct 1;128(4):819-836. doi: 10.1152/jn.00257.2022. Epub 2022 Aug 31. J Neurophysiol. 2022. PMID: 36043803 Free PMC article.
-
In vivo stimulus-induced vasodilation occurs without IP3 receptor activation and may precede astrocytic calcium increase.J Neurosci. 2013 May 8;33(19):8411-22. doi: 10.1523/JNEUROSCI.3285-12.2013. J Neurosci. 2013. PMID: 23658179 Free PMC article.
-
How to build a Laser Speckle Contrast Imaging (LSCI) system to monitor blood flow.J Vis Exp. 2010 Nov 11;(45):2004. doi: 10.3791/2004. J Vis Exp. 2010. PMID: 21113112 Free PMC article.
-
Reduced interhemispheric functional connectivity of children with autism spectrum disorder: evidence from functional near infrared spectroscopy studies.Biomed Opt Express. 2014 Mar 27;5(4):1262-74. doi: 10.1364/BOE.5.001262. eCollection 2014 Apr 1. Biomed Opt Express. 2014. PMID: 24761305 Free PMC article.
-
Preserved canonicality of the BOLD hemodynamic response reflects healthy cognition: Insights into the healthy brain through the window of Multiple Sclerosis.Neuroimage. 2019 Apr 15;190:46-55. doi: 10.1016/j.neuroimage.2017.12.081. Epub 2018 Feb 15. Neuroimage. 2019. PMID: 29454932 Free PMC article.
References
-
- Belliveau, J. W., Kennedy, D. N., Jr., McKinstry, R. C., Buchbinder, B. R., Weisskoff, R. M., Cohen, M. S., Vevea, J. M., Brady, T. J. & Rosen, B. R. (1991) Science 254, 716-719. - PubMed
-
- Devor, A., Dunn, A. K., Andermann, M. L., Ulbert, I., Boas, D. A. & Dale, A. M. (2003) Neuron 39, 353-359. - PubMed
-
- Jones, M., Hewson-Stoate, N., Martindale, J., Redgrave, P. & Mayhew, J. (2004) NeuroImage 22, 956-965. - PubMed
Publication types
MeSH terms
Substances
Grants and funding
LinkOut - more resources
Full Text Sources
Other Literature Sources
