Global transcription profiling reveals comprehensive insights into hypoxic response in Arabidopsis
- PMID: 15734912
- PMCID: PMC1065411
- DOI: 10.1104/pp.104.055475
Global transcription profiling reveals comprehensive insights into hypoxic response in Arabidopsis
Abstract
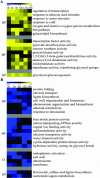
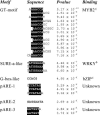
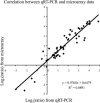
Plants have evolved adaptation mechanisms to sense oxygen deficiency in their environments and make coordinated physiological and structural adjustments to enhance their hypoxic tolerance. To gain insight into how plants respond to low-oxygen stress, gene expression profiling using whole-genome DNA amplicon microarrays was carried out at seven time points over 24 h, in wild-type and transgenic P(SAG12):ipt Arabidopsis (Arabidopsis thaliana) plants under normoxic and hypoxic conditions. Transcript levels of genes involved in glycolysis and fermentation pathways, ethylene synthesis and perception, calcium signaling, nitrogen utilization, trehalose metabolism, and alkaloid synthesis were significantly altered in response to oxygen limitation. Analysis based on gene ontology assignments suggested a significant down-regulation of genes whose functions are associated with cell walls, nucleosome structures, water channels, and ion transporters and a significant up-regulation of genes involved in transcriptional regulation, protein kinase activity, and auxin responses under conditions of oxygen shortage. Promoter analysis on a cluster of up-regulated genes revealed a significant overrepresentation of the AtMYB2-binding motif (GT motif), a sugar response element-like motif, and a G-box-related sequence, and also identified several putative anaerobic response elements. Finally, quantitative real-time polymerase chain reactions using 29 selected genes independently verified the microarray results. This study represents one of the most comprehensive analyses conducted to date investigating hypoxia-responsive transcriptional networks in plants.
Figures

Similar articles
-
HRE1 and HRE2, two hypoxia-inducible ethylene response factors, affect anaerobic responses in Arabidopsis thaliana.Plant J. 2010 Apr;62(2):302-15. doi: 10.1111/j.1365-313X.2010.04149.x. Epub 2010 Jan 22. Plant J. 2010. PMID: 20113439
-
Seed-specific elevation of non-symbiotic hemoglobin AtHb1: beneficial effects and underlying molecular networks in Arabidopsis thaliana.BMC Plant Biol. 2011 Mar 15;11:48. doi: 10.1186/1471-2229-11-48. BMC Plant Biol. 2011. PMID: 21406103 Free PMC article.
-
Gene Regulation and Survival under Hypoxia Requires Starch Availability and Metabolism.Plant Physiol. 2018 Feb;176(2):1286-1298. doi: 10.1104/pp.17.01002. Epub 2017 Oct 30. Plant Physiol. 2018. PMID: 29084901 Free PMC article.
-
Enhancing the anaerobic response.Ann Bot. 2003 Jan;91 Spec No(2):111-7. doi: 10.1093/aob/mcf048. Ann Bot. 2003. PMID: 12509332 Free PMC article. Review.
-
Genetic responses to phosphorus deficiency.Ann Bot. 2004 Sep;94(3):323-32. doi: 10.1093/aob/mch156. Epub 2004 Aug 3. Ann Bot. 2004. PMID: 15292042 Free PMC article. Review.
Cited by
-
Identification of Functional Genetic Variations Underlying Flooding Tolerance in Brazilian Soybean Genotypes.Int J Mol Sci. 2022 Sep 13;23(18):10611. doi: 10.3390/ijms231810611. Int J Mol Sci. 2022. PMID: 36142529 Free PMC article.
-
The Anaerobic Product Ethanol Promotes Autophagy-Dependent Submergence Tolerance in Arabidopsis.Int J Mol Sci. 2020 Oct 5;21(19):7361. doi: 10.3390/ijms21197361. Int J Mol Sci. 2020. PMID: 33028029 Free PMC article.
-
Ethylene enhances root water transport and aquaporin expression in trembling aspen (Populus tremuloides) exposed to root hypoxia.BMC Plant Biol. 2021 May 21;21(1):227. doi: 10.1186/s12870-021-02995-7. BMC Plant Biol. 2021. PMID: 34020594 Free PMC article.
-
Involvement of Arabidopsis prolyl 4 hydroxylases in hypoxia, anoxia and mechanical wounding.Plant Signal Behav. 2007 Sep;2(5):368-9. doi: 10.4161/psb.2.5.4462. Plant Signal Behav. 2007. PMID: 19704601 Free PMC article.
-
Stable expression of aquaporins and hypoxia-responsive genes in adventitious roots are linked to maintaining hydraulic conductance in tobacco (Nicotiana tabacum) exposed to root hypoxia.PLoS One. 2019 Feb 7;14(2):e0212059. doi: 10.1371/journal.pone.0212059. eCollection 2019. PLoS One. 2019. PMID: 30730995 Free PMC article.
References
-
- Ball CA, Sherlock G, Parkinson H, Rocca-Sera P, Brooksbank C, Causton HC, Cavalieri D, Gaasterland T, Hingamp P, Holstege F, et al (2002) Standards for microarray data. Science 298: 539 - PubMed
-
- Baxter-Burrell A, Yang Z, Springer PS, Bailey-Serres J (2002) RopGAP4-dependent Rop GTPase rheostat control of Arabidopsis oxygen deprivation tolerance. Science 296: 2026–2028 - PubMed
-
- Brazma A, Hingamp P, Quackenbush J, Sherlock G, Spellman P, Stoeckert C, Aach J, Ansorge W, Ball CA, Causton HC, et al (2001) Minimum information about a microarray experiment (MIAME)—toward standards for microarray data. Nat Genet 29: 365–371 - PubMed
Publication types
MeSH terms
Substances
LinkOut - more resources
Full Text Sources
Molecular Biology Databases
Miscellaneous

