Comparative Study
. 2005 Mar 17;434(7031):338-45.
doi: 10.1038/nature03441. Epub 2005 Feb 27.

Systematic discovery of regulatory motifs in human promoters and 3' UTRs by comparison of several mammals

Affiliations
Comparative Study

Systematic discovery of regulatory motifs in human promoters and 3' UTRs by comparison of several mammals

Xiaohui Xie et al. Nature. .

Abstract

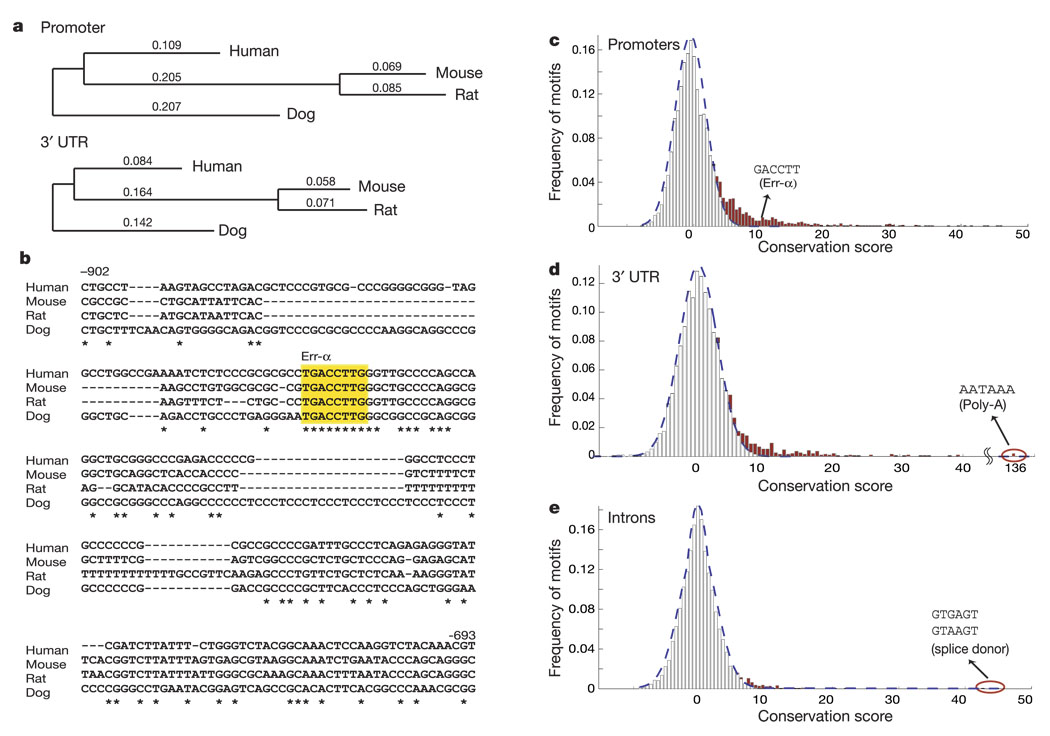
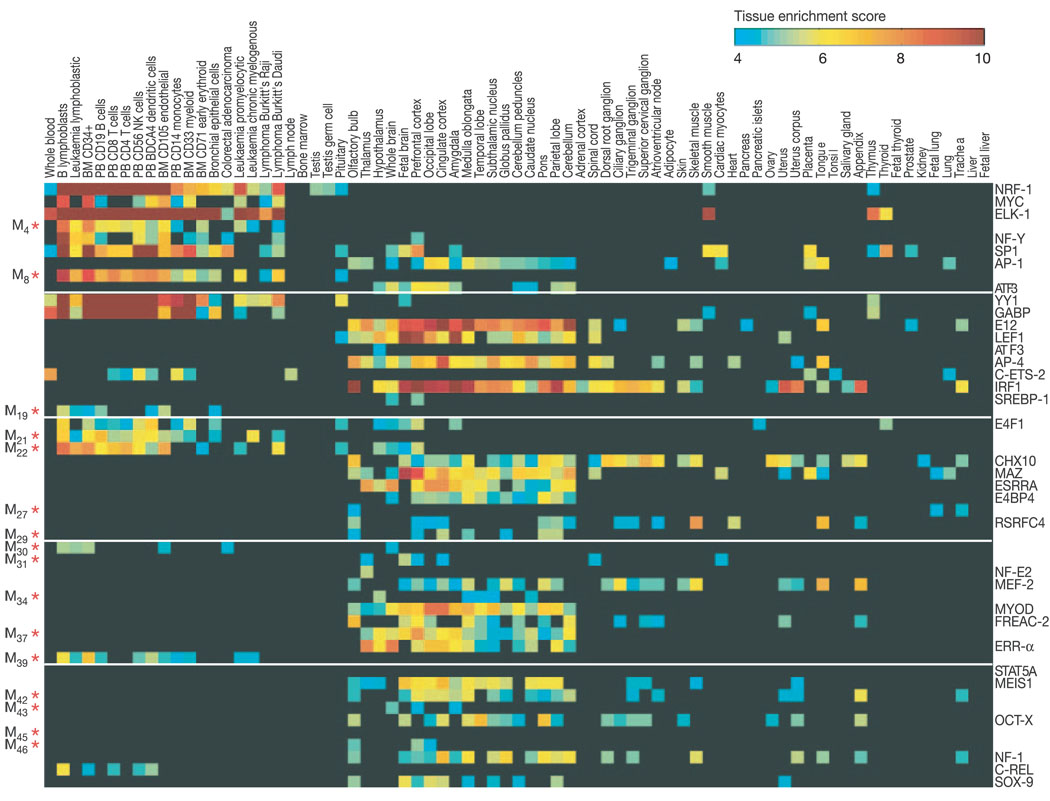
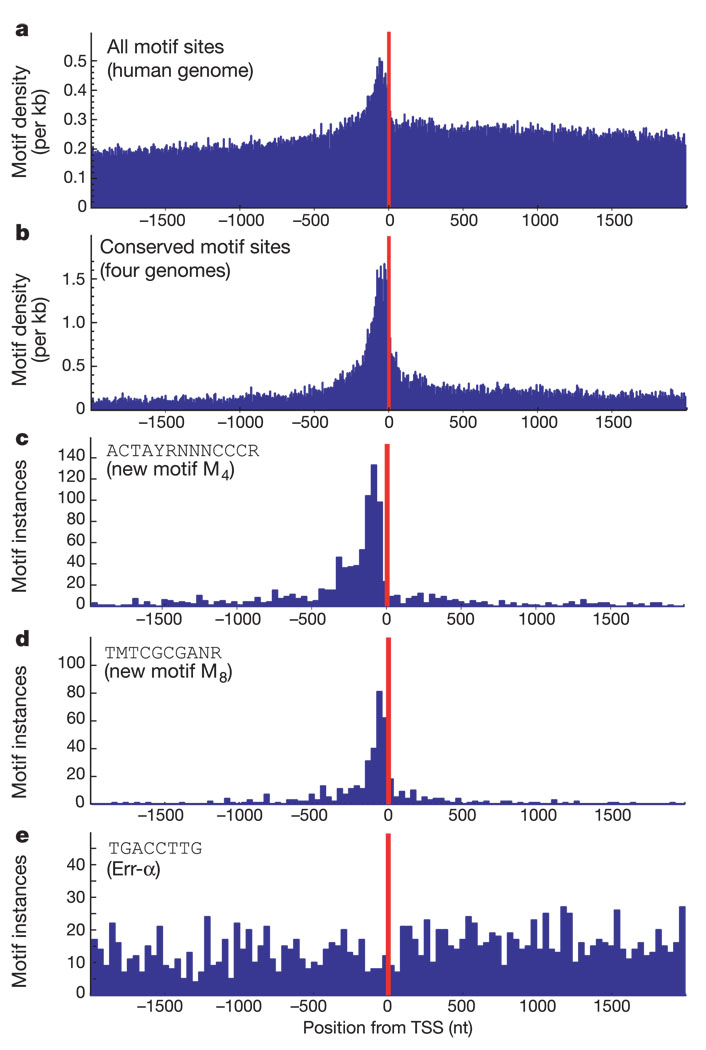
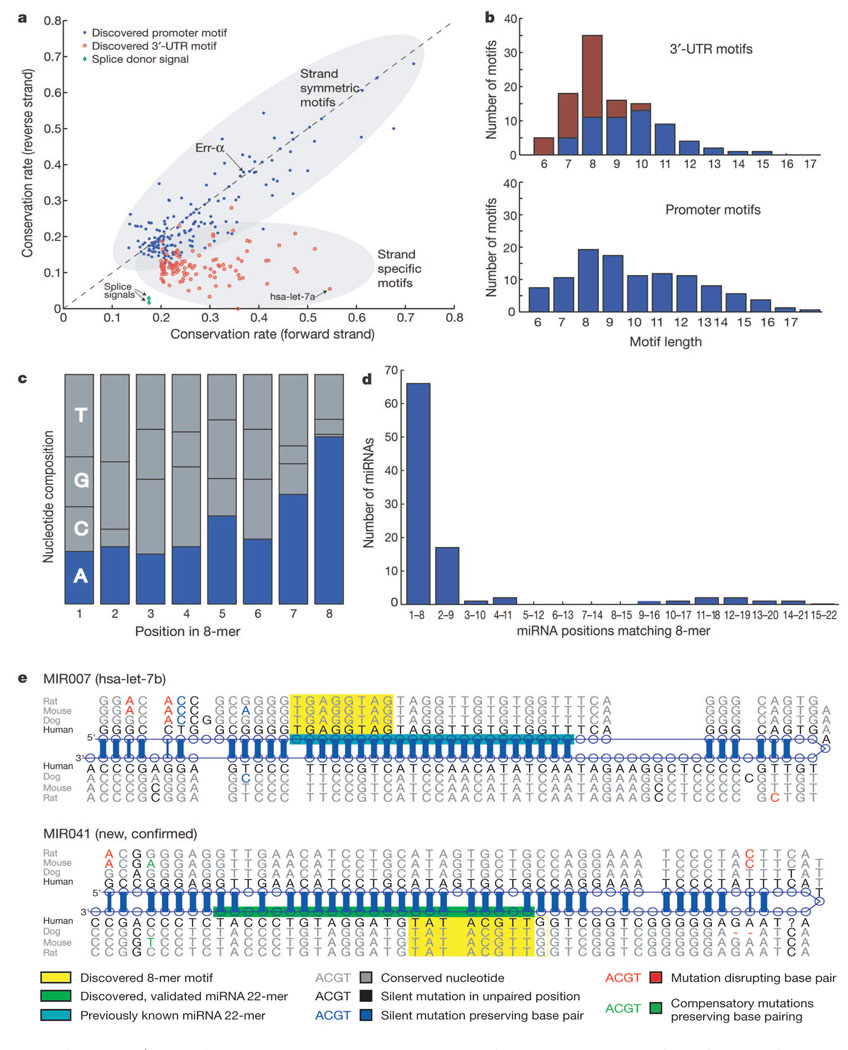
Comprehensive identification of all functional elements encoded in the human genome is a fundamental need in biomedical research. Here, we present a comparative analysis of the human, mouse, rat and dog genomes to create a systematic catalogue of common regulatory motifs in promoters and 3' untranslated regions (3' UTRs). The promoter analysis yields 174 candidate motifs, including most previously known transcription-factor binding sites and 105 new motifs. The 3'-UTR analysis yields 106 motifs likely to be involved in post-transcriptional regulation. Nearly one-half are associated with microRNAs (miRNAs), leading to the discovery of many new miRNA genes and their likely target genes. Our results suggest that previous estimates of the number of human miRNA genes were low, and that miRNAs regulate at least 20% of human genes. The overall results provide a systematic view of gene regulation in the human, which will be refined as additional mammalian genomes become available.


Figures

Figure 1
Figure 1
Conservation properties in human promoter regions and 3′ UTRs. a, Evolutionary tree relating the four mammalian species. Branch lengths denote number of substitutions per site. Average nucleotide per cent identity to human is 62% for mouse, 60% for rat and 69% for dog in promoter regions, and respectively 68%, 67% and 76% in 3′ UTRs. b, Conservation in GABPA promoter region reveals functional Err-α motif. Asterisks denote conserved bases. The yellow box marks the experimentally validated Err-α-binding site. c–e, Excess conservation in promoter and 3′-UTR regions reveals short sequences under evolutionary selection. Motif conservation score (MCS) distribution is shown for all 6-mer motifs in aligned promoters (c), 3′-UTR regions (d) and introns (e). The dashed curve shows fit to gaussian distribution. Excess conservation relative to this distribution is shown in red.
Figure 2
Figure 2
Tissue specificity of expression for genes containing discovered motifs. For each of the 174 motifs, we defined the set of genes whose promoters contain conserved occurrences of the motif, and tested for enriched expression in 75 human tissues. The enrichment score (see Methods) is represented in pseudo-colour, with only scores greater than 4 shown. Motifs are ordered by MCS; asterisks denote new motifs (left); factor names are shown for known motifs (right). Only the top 50 motifs are shown. The maximum enrichment score across all tissues is reported in Table 1. Control gene sets were also constructed for each motif, consisting of an equal-sized set of genes in which the motif occurs but is not conserved; these control sets show little or no enrichment across the same tissues (see Supplementary Fig. S2).
Figure 3
Figure 3
Discovered promoter motifs show positional bias with respect to transcriptional start site (TSS). a, Distribution of distance from TSS for all occurrences in human genome peaks within 100 bp before TSS. b, Distribution for conserved occurrences shows an even stronger peak. c, d, New motifs M4 and M8 peak at −81 and −69 respectively. e, Some motifs do not show specific peaks, including the known Err-α motif. nt, nucleotides.
Figure 4
Figure 4
Properties of discovered 3′-UTR motifs and corresponding miRNA genes. a, Directionality of 3′-UTR motifs revealed by comparing conservation on forward and reverse strands. Strand preference is also seen for splice signals, but conservation of promoter motifs is largely symmetric. hsa-let-7a, Homo sapiens let-7a. b, Length distribution of 3′-UTR motifs shows abundance of motifs of length 8, but no such preference is seen for promoter motifs. Motifs overlapping conserved 8-mers (red) account for the length bias. c, A total of 72% of 8-mer motifs end with nucleotide A, suggesting complementarity with mature miRNA genes, frequently starting with U. d, Ninety-five per cent of discovered 8-mers match known miRNA genes at position 1–8 or 2–9. e, Alignments of known and new miRNA stem-loop structures, identified by their complementarity to a discovered 8-mer motif. New ~22-bp mature miRNA products predicted based on the observation shown in d and validated experimentally.

References

    1. Gumucio DL, et al. Phylogenetic footprinting reveals a nuclear protein which binds to silencer sequences in the human gamma and epsilon globin genes. Mol. Cell. Biol. 1992;12:4919–4929. - PMC - PubMed
    1. Wasserman WW, Palumbo M, Thompson W, Fickett JW, Lawrence CE. Human-mouse genome comparisons to locate regulatory sites. Nature Genet. 2000;26:225–228. - PubMed
    1. Dubchak I, et al. Active conservation of noncoding sequences revealed by three-way species comparisons. Genome Res. 2000;10:1304–1306. - PMC - PubMed
    1. Pennacchio LA, et al. An apolipoprotein influencing triglycerides in humans and mice revealed by comparative sequencing. Science. 2001;294:169–173. - PubMed
    1. Boffelli D, et al. Phylogenetic shadowing of primate sequences to find functional regions of the human genome. Science. 2003;299:1391–1394. - PubMed

Publication types