

Differential expression of genes within the cochlea as defined by a custom mouse inner ear microarray
- PMID: 15735932
- PMCID: PMC2504641
- DOI: 10.1007/s10162-004-5046-x
Differential expression of genes within the cochlea as defined by a custom mouse inner ear microarray
Abstract
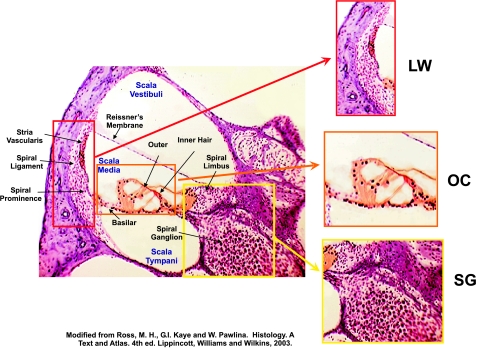
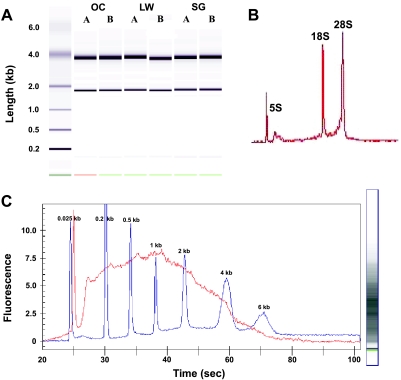
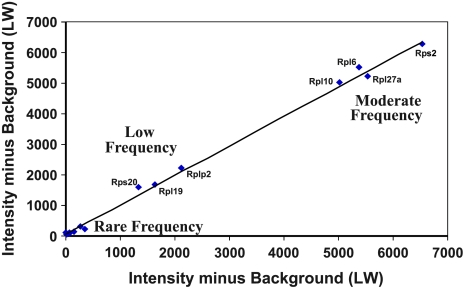
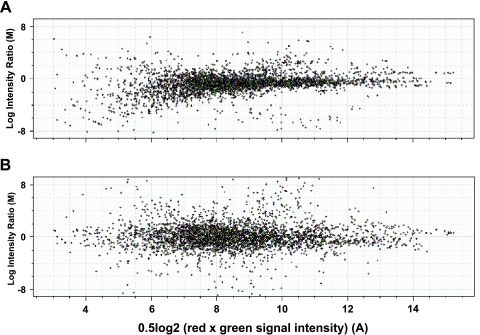
Microarray analyses have contributed greatly to the rapid understanding of functional genomics through the identification of gene networks as well as gene discovery. To facilitate functional genomics of the inner ear, we have developed a mouse inner-ear-pertinent custom microarray chip (CMA-IE1). Nonredundant cDNA clones were obtained from two cDNA library resources: the RIKEN subtracted inner ear set and the NIH organ of Corti library. At least 2000 cDNAs unique to the inner ear were present on the chip. Comparisons were performed to examine the relative expression levels of these unique cDNAs within the organ of Corti, lateral wall, and spiral ganglion. Total RNA samples were obtained from the three cochlear-dissected fractions from adult CF-1 mice. The total RNA was linearly amplified, and a dendrimer-based system was utilized to enhance the hybridization signal. Differentially expressed genes were verified by comparison to known gene expression patterns in the cochlea or by correlation with genes and gene families deduced to be present in the three tissue types. Approximately 22-25% of the genes on the array had significant levels of expression. A number of differentially expressed genes were detected in each tissue fraction. These included genes with known functional roles, hypothetical genes, and various unknown or uncharacterized genes. Four of the differentially expressed genes found in the organ of Corti are linked to deafness loci. None of these are hypothetical or unknown genes.
Figures
Similar articles
-
Characterisation of DRASIC in the mouse inner ear.Hear Res. 2004 Apr;190(1-2):149-60. doi: 10.1016/S0378-5955(04)00015-2. Hear Res. 2004. PMID: 15051137
-
Laser-capture micro dissection combined with next-generation sequencing analysis of cell type-specific deafness gene expression in the mouse cochlea.Hear Res. 2017 May;348:87-97. doi: 10.1016/j.heares.2017.02.017. Epub 2017 Mar 3. Hear Res. 2017. PMID: 28263850
-
An inner ear gene expression database.J Assoc Res Otolaryngol. 2002 Jun;3(2):140-8. doi: 10.1007/s101620020029. J Assoc Res Otolaryngol. 2002. PMID: 12162364 Free PMC article.
-
Understanding inner ear development with gene expression profiling.J Neurobiol. 2002 Nov 5;53(2):276-85. doi: 10.1002/neu.10125. J Neurobiol. 2002. PMID: 12382281 Review.
-
[Molecular biology of hearing].Laryngorhinootologie. 2011 Mar;90 Suppl 1:S22-34. doi: 10.1055/s-0030-1270444. Epub 2011 Apr 26. Laryngorhinootologie. 2011. PMID: 21523631 Review. German.
Cited by
-
Mutation analysis of the SLC4A11 gene in Indian families with congenital hereditary endothelial dystrophy 2 and a review of the literature.Mol Vis. 2013 Aug 2;19:1694-706. Print 2013. Mol Vis. 2013. PMID: 23922488 Free PMC article. Review.
-
Slc4a11 gene disruption in mice: cellular targets of sensorineuronal abnormalities.J Biol Chem. 2009 Sep 25;284(39):26882-96. doi: 10.1074/jbc.M109.008102. Epub 2009 Jul 8. J Biol Chem. 2009. PMID: 19586905 Free PMC article.
-
Differential expression of KCNQ4 in inner hair cells and sensory neurons is the basis of progressive high-frequency hearing loss.J Neurosci. 2005 Oct 5;25(40):9285-93. doi: 10.1523/JNEUROSCI.2110-05.2005. J Neurosci. 2005. PMID: 16207888 Free PMC article.
-
Ectopic mineralization in the middle ear and chronic otitis media with effusion caused by RPL38 deficiency in the Tail-short (Ts) mouse.J Biol Chem. 2011 Jan 28;286(4):3079-93. doi: 10.1074/jbc.M110.184598. Epub 2010 Nov 9. J Biol Chem. 2011. PMID: 21062742 Free PMC article.
-
Single-cell RNA-sequencing of stria vascularis cells in the adult Slc26a4-/- mouse.BMC Med Genomics. 2023 Jun 15;16(1):133. doi: 10.1186/s12920-023-01549-0. BMC Med Genomics. 2023. PMID: 37322474 Free PMC article.
References
-
- Agrup C, Bagger-Sjoback D, Fryckstedt J. Protein kinase and protein phosphatase presence in the stria vascularis. Pflugers Arch. 1997;433:603–608. - PubMed
-
- Ahmed ZM, Riazuddin S, Ahmad J, Bernstein SL, Guo Y, Sabar MF, Sieving P, Griffith AJ, Friedman TB, Belyantseva IA, et al. PCDH15 is expressed in the neurosensory epithelium of the eye and ear and mutant alleles are responsible for both USH1F and DFNB23. Hum. Mol. Genet. 2003;12:3215–3223. - PubMed
Publication types
MeSH terms
Grants and funding
LinkOut - more resources
Full Text Sources
Medical
