. 2005 Mar;3(3):e68.
doi: 10.1371/journal.pbio.0030068. Epub 2005 Mar 1.

Highly nonrandom features of synaptic connectivity in local cortical circuits

Affiliations

Highly nonrandom features of synaptic connectivity in local cortical circuits

Sen Song et al. PLoS Biol. 2005 Mar.

Erratum in

  • PLoS Biol. 2005 Oct;3(10):e350

Abstract

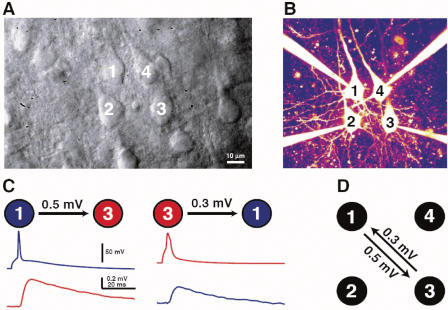
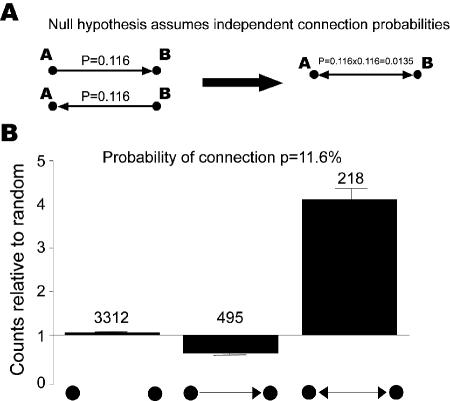
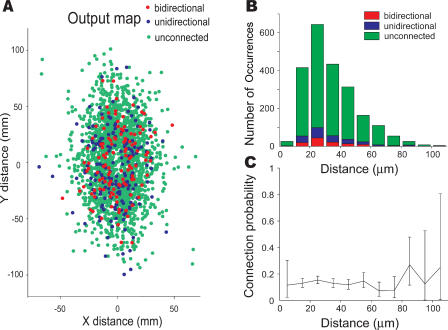
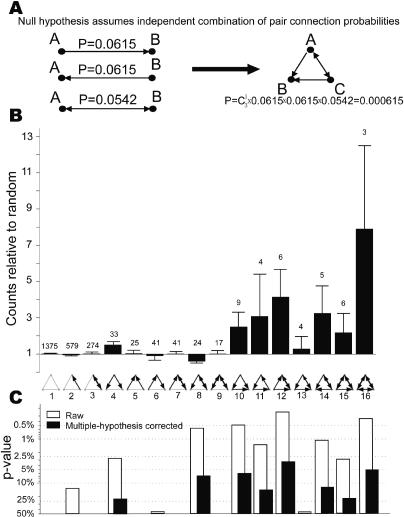
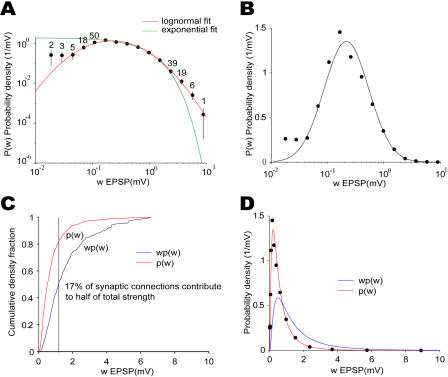
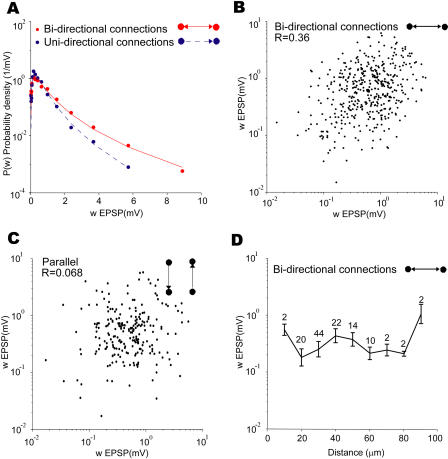
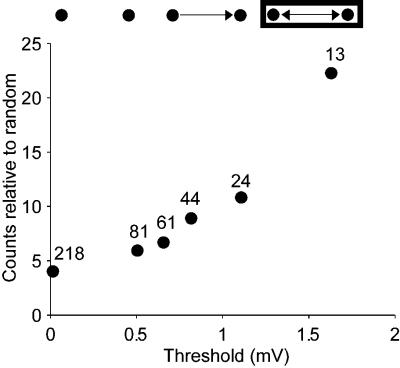
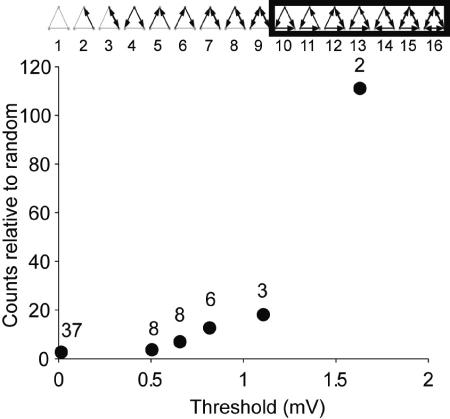
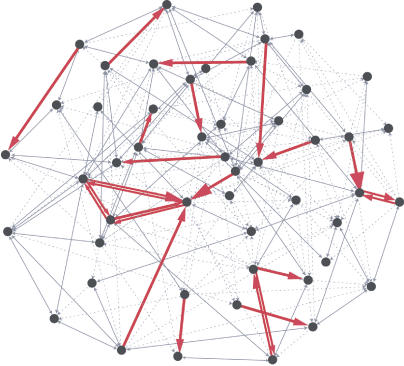
How different is local cortical circuitry from a random network? To answer this question, we probed synaptic connections with several hundred simultaneous quadruple whole-cell recordings from layer 5 pyramidal neurons in the rat visual cortex. Analysis of this dataset revealed several nonrandom features in synaptic connectivity. We confirmed previous reports that bidirectional connections are more common than expected in a random network. We found that several highly clustered three-neuron connectivity patterns are overrepresented, suggesting that connections tend to cluster together. We also analyzed synaptic connection strength as defined by the peak excitatory postsynaptic potential amplitude. We found that the distribution of synaptic connection strength differs significantly from the Poisson distribution and can be fitted by a lognormal distribution. Such a distribution has a heavier tail and implies that synaptic weight is concentrated among few synaptic connections. In addition, the strengths of synaptic connections sharing pre- or postsynaptic neurons are correlated, implying that strong connections are even more clustered than the weak ones. Therefore, the local cortical network structure can be viewed as a skeleton of stronger connections in a sea of weaker ones. Such a skeleton is likely to play an important role in network dynamics and should be investigated further.


Figures

Figure 1
Figure 1. Illustration of a Quadruple Whole-Cell Recording
(A) Dodt contrast image showing four thick-tufted L5 neurons before patching on. (B) Fluorescent image of the same four cells in whole-cell configuration. (C) Average EPSP waveform measured in the postsynaptic neuron (bottom) while evoking action potentials in the presynaptic neuron (top). (D) Diagram of detected synaptic connections and their strengths for this quadruple recording.
Figure 2
Figure 2. Two-Neuron Connectivity Patterns Are Nonrandom
(A) Null hypothesis is generated by assuming independent probabilities of connection. (B) Reciprocal connections are four times more likely than predicted by the null hypothesis (p < 0.0001, Monte Carlo simulation to test for overrepresentation). Numbers on top of bars are actual counts. Error bars are standard deviations estimated by bootstrap method.
Figure 3
Figure 3. Probability of Connection among Adjacent Neurons Does Not Depend Strongly on the Interneuron Distance
(A) Relative location of labeled neurons in the plane of the section. Positive direction of y-axis is aligned with apical dendrite. Potentially presynaptic neuron is located at the origin. Red—bidirectionally connected pairs; blue—unidirectionally connected pairs; green—unconnected pairs. (B) Histogram showing the numbers of pairs in the three classes as a function of distance between neurons (Euclidian distance was calculated from relative X, Y, Z coordinates). (C) Probability of connection versus interneuron distance. Error bars are 95% confidence intervals estimated from binomial distribution.
Figure 4
Figure 4. Several Three-Neuron Patterns Are Overrepresented as Compared to the Random Network
(A) Null hypothesis for three-neuron patterns assumes independent combinations of connection probabilities of two kinds of two-neuron patterns. (B) Ratio of actual counts (numbers above bars) to that predicted by the null hypothesis. Error bars are standard deviations estimated by bootstrap method. (C) Raw (open bars) and multiple-hypothesis testing corrected (filled bars) p-values. p-values above 0.5 are not shown.
Figure 5
Figure 5. Distribution of Synaptic Connection Strength Has a Heavy Tail
(A) Estimated probability density function in log–log space, with both lognormal fit (p[w] = 0.426exp[−(ln[w] + 0.702)2/(2 × 0.9355)2]/w) and exponential fit (p[w] = 1.82exp[−1.683w]). Notice that the lognormal fit has a heavier tail than the exponential distribution. Error bars are standard deviations estimated by bootstrap method (not shown when narrower than the dot). The numbers on top on the dots are the actual counts (not shown when more than 50). (B) Estimated probability density distribution in semilog space, with the lognormal fit. The lognormal function shows up as a normal function in the semilog space. (C) Empirical cumulative density function for both the probability distribution of synaptic strengths and the synaptic contribution (normalized product of probability and connection strength). They are generated directly from the data rather than the fits. The vertical line illustrates the fact that 17% of the synaptic connections contribute to half of the total synaptic strengths. (D) Probability density function of synaptic connection strengths p(w) fitted by a lognormal function and the synaptic contribution defined as the product of the strength, w, and p(w). The total areas under both curves are normalized to 1.
Figure 6
Figure 6. Bidirectionally Connected Pairs Contain Connections That Are Stronger and Correlated
(A) Synaptic connections in bidirectionally connected pairs are on average stronger than those in unidirectionally connected pairs. The probability density distribution for both the reciprocal (red solid, p(w) = 0.41exp(−(ln w + 0.60)2/(2 × 0.9762)/w) and nonreciprocal (blue dashed, p(w) = 0.47exp(−(ln w + 0.81)2/(2 × 0.8342)/w) connections are shown. (B) In bidirectionally connected pairs synaptic connection strengths are moderately but significantly correlated (R = 0.36, p < 0.0001). (C) Scatter plot of the strength of synaptic connections that shared no pre- and postsynaptic neurons in the same quadruple recording. There might be other connections in the quadruplet besides these two connections. No significant correlation is observed (R = 0.068, p = 0.48). All correlations calculated using Pearson's R method in log space. (D) Average connection strength for bidirectional connections does not vary systemically with interneuron distance (one-way ANOVA, p = 0.068). Numbers on top of data points are the number of connections. Error bars are standard errors of the mean.
Figure 7
Figure 7. Stronger Connections Are More Likely Reciprocal than Weaker Ones
Overrepresentation of bidirectionally connected motifs gets more dramatic for higher threshold of connection strength (counts differ from random with p < 0.001 for all thresholds, Monte Carlo simulation). Significance of monotonicity is assessed by applying the Kolmogorov-Smirnov test (p < 3.5 × 10⁻¹⁰ for all successive pairs). Numbers on top of dots show the counts of actual pairs.
Figure 8
Figure 8. Stronger Connections Are More Clustered than Weaker Ones
Relative overrepresentation of highly connected three-neuron motifs monotonically increases as the threshold is raised (counts differ from random p < 0.001 for all thresholds, Monte Carlo simulation). Significance of monotonicity is assessed by applying the Kolmogorov-Smirnov test (p <3.5 × 10⁻¹⁰ for all successive pairs). Numbers show the actual triplet counts. For the second to highest threshold, two instances of pattern 12 and one instance of pattern 16 survive. For the highest threshold, one instance each of pattern 12 and 15 survive (one of the connections in pattern 16 drops out and it becomes pattern 15).
Figure 9
Figure 9. Statistically Reconstructed Network of 50 Layer 5 Pyramidal Neurons Illustrates That Stronger Connections form a Skeleton Immersed in a Sea of the Weaker Ones
Details of statistical reconstruction are given in Materials and Methods. For illustrative purposes, neurons are arranged so that strongly interconnected nodes are close by. Dotted arrows are weak (<1 mV) unidirectional connections; solid arrows are weak bidirectional connections. Red arrows are strong (>1 mV) unidirectional connections with arrow size indicating the strength. Red arrows with double lines are strong bidirectional connections.

References

    1. White JG, Southgate E, Thomson JN, Brenner S. The structure of the nervous system of the nematode Caenorhabditis elegans . Philos Trans R Soc Lond B Biol Sci. 1986;314:1–340. - PubMed
    1. Denk W, Horstmann H. Serial block-face scanning electron microscopy to reconstruct three-dimensional tissue nanostructure. PLoS Biol. 2004;2:e329. - PMC - PubMed
    1. Thomson AM, Bannister AP. Interlaminar connections in the neocortex. Cereb Cortex. 2003;13:5–14. - PubMed
    1. Barthó P, Hirase H, Monconduit L, Zugaro M, Harris KD, et al. Characterization of neocortical principal cells and interneurons by network interactions and extracellular features. J Neurophysiol. 2004;92:600–608. - PubMed
    1. Sjöström PJ, Turrigiano GG, Nelson SB. Rate, timing, and cooperativity jointly determine cortical synaptic plasticity. Neuron. 2001;32:1149–1164. - PubMed

Publication types