Review
. 2005 Mar;105(3):229-66.
doi: 10.1016/j.pharmthera.2004.10.004. Epub 2004 Dec 9.

Cellular mechanisms underlying acquired epilepsy: the calcium hypothesis of the induction and maintainance of epilepsy

Affiliations
Review

Cellular mechanisms underlying acquired epilepsy: the calcium hypothesis of the induction and maintainance of epilepsy

Robert J Delorenzo et al. Pharmacol Ther. 2005 Mar.

Erratum in

  • Pharmacol Ther. 2006 Jul;111(1):287

Corrected and republished in

Abstract

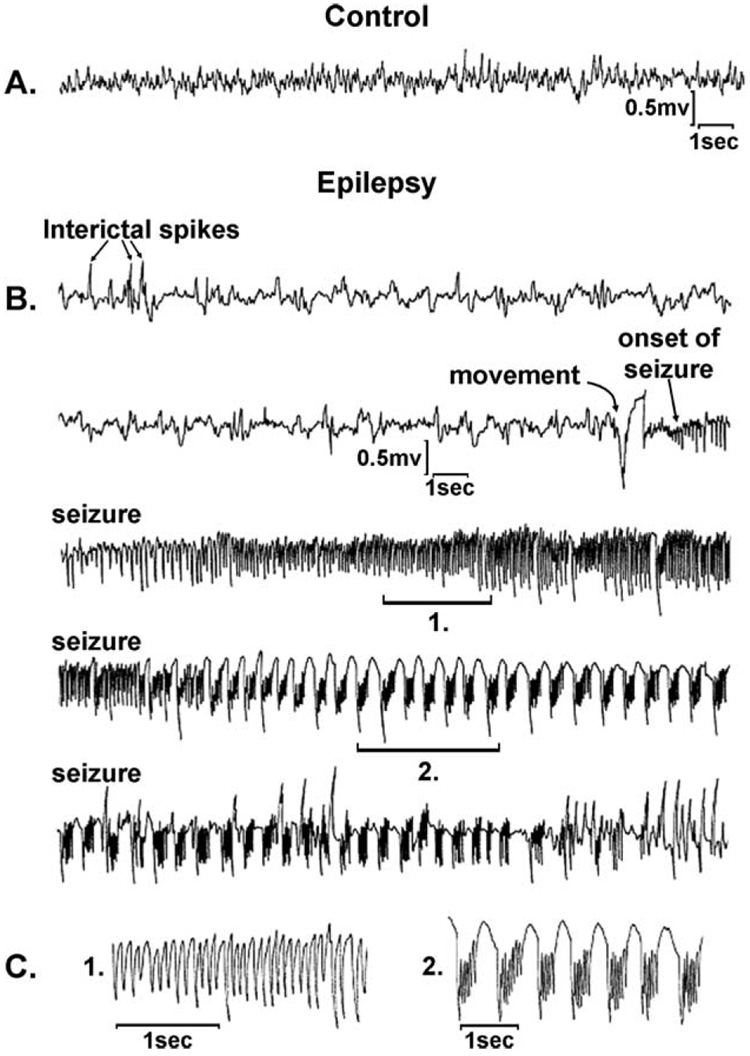
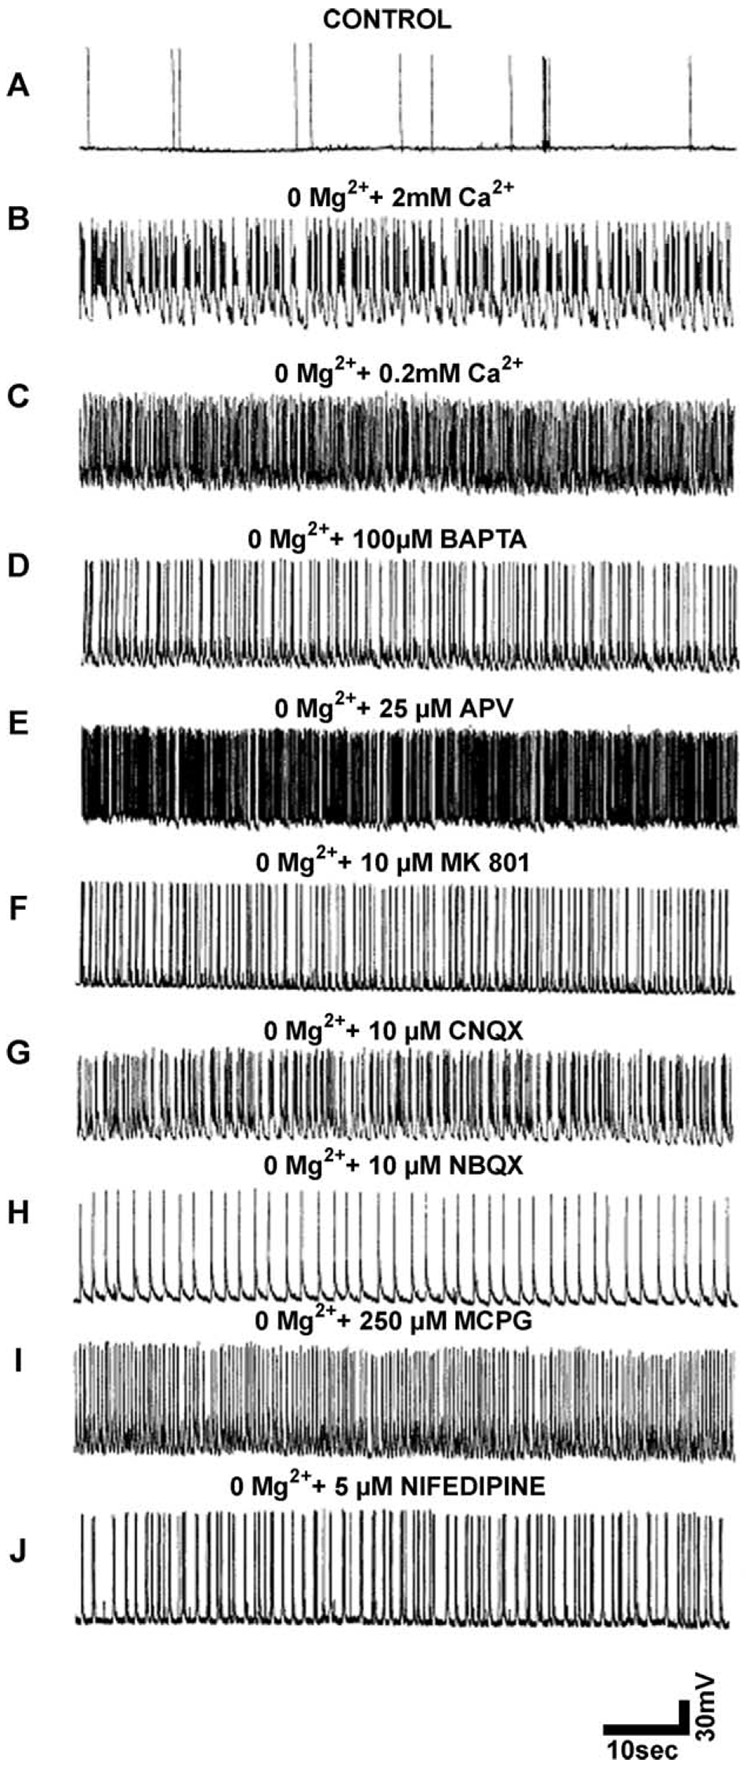
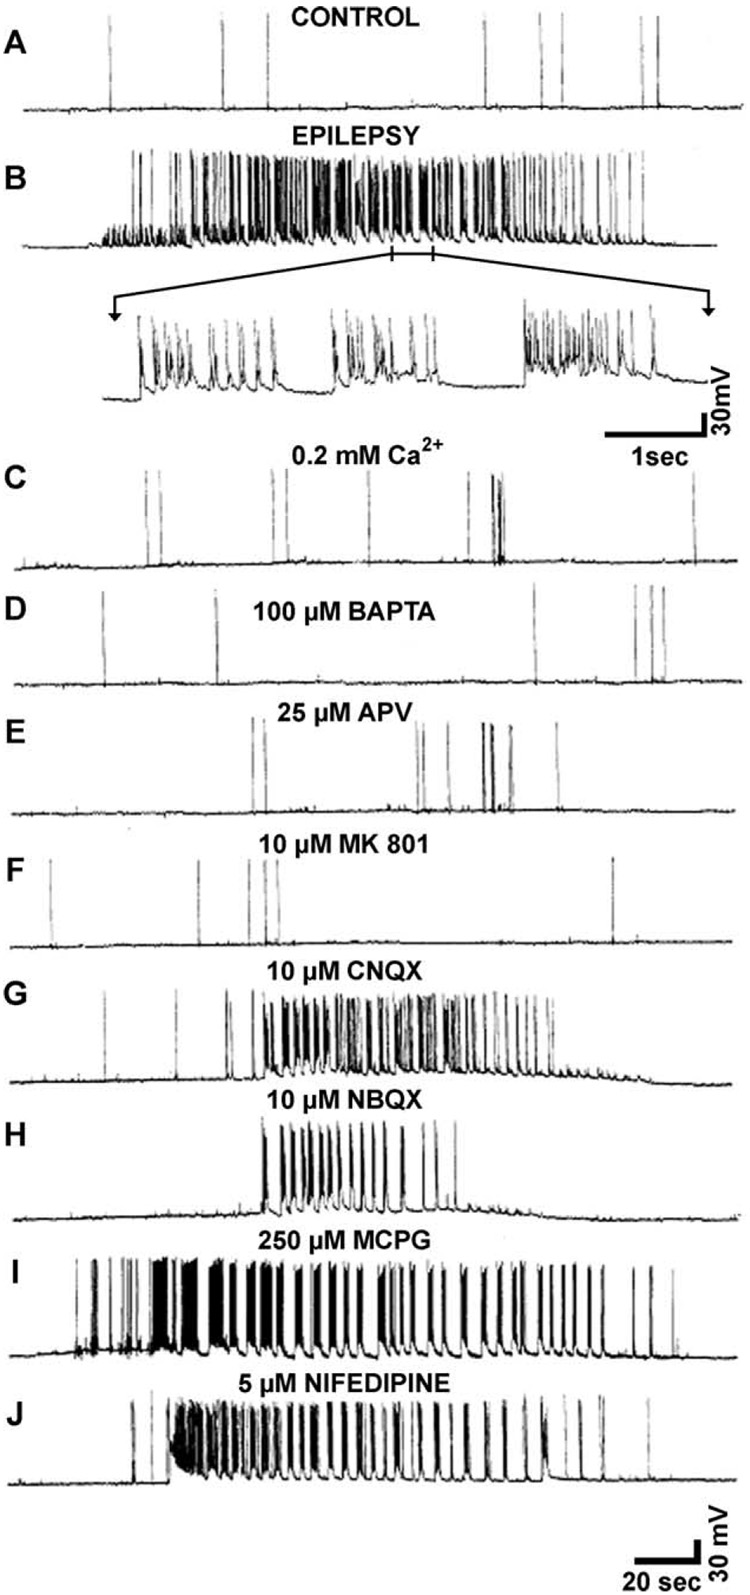
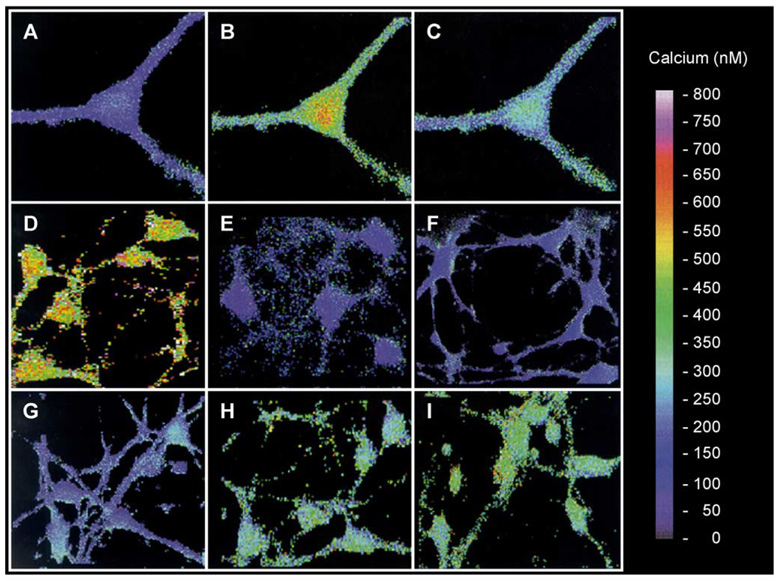
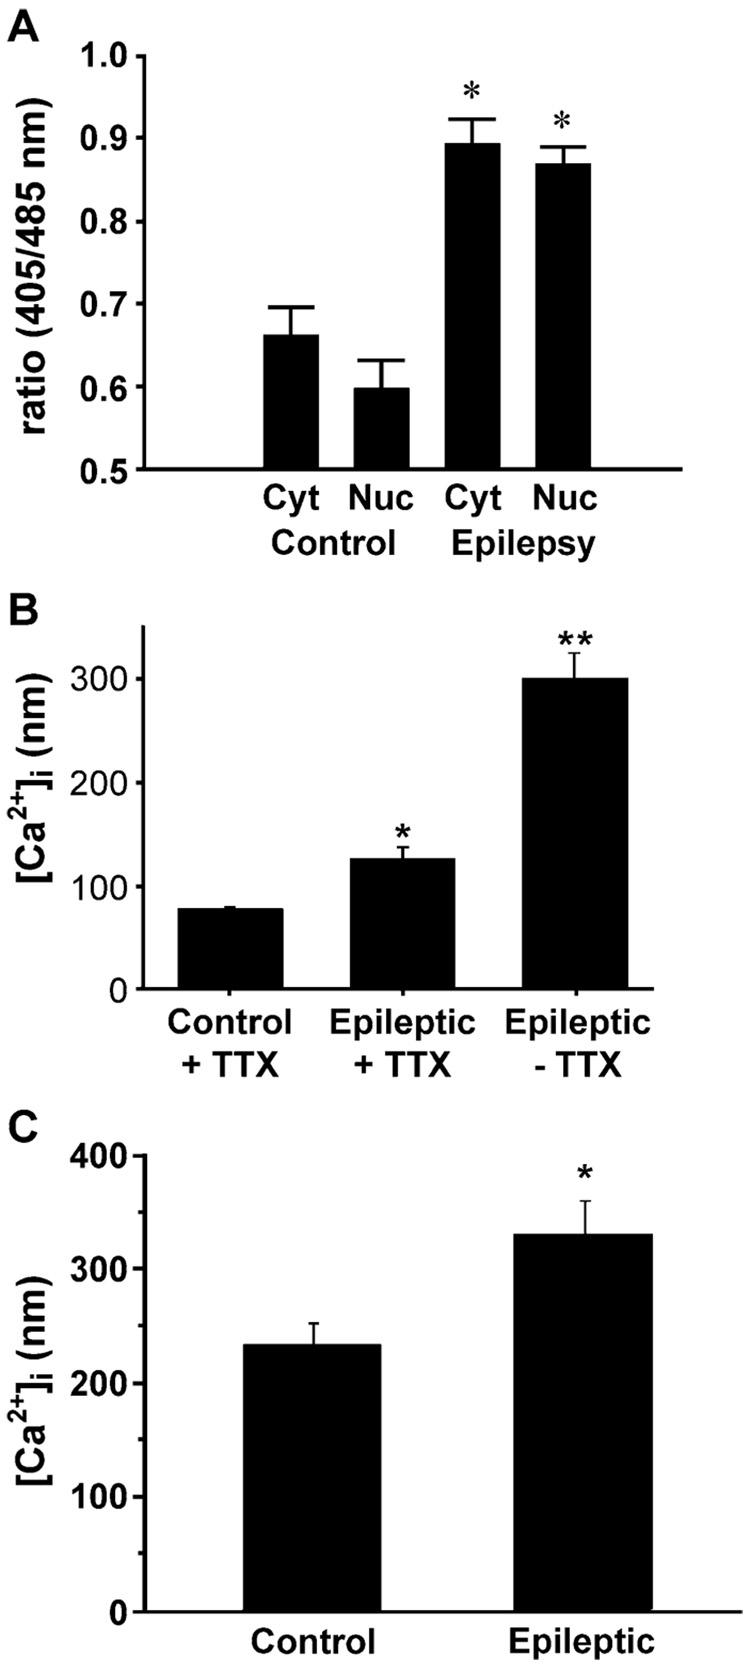
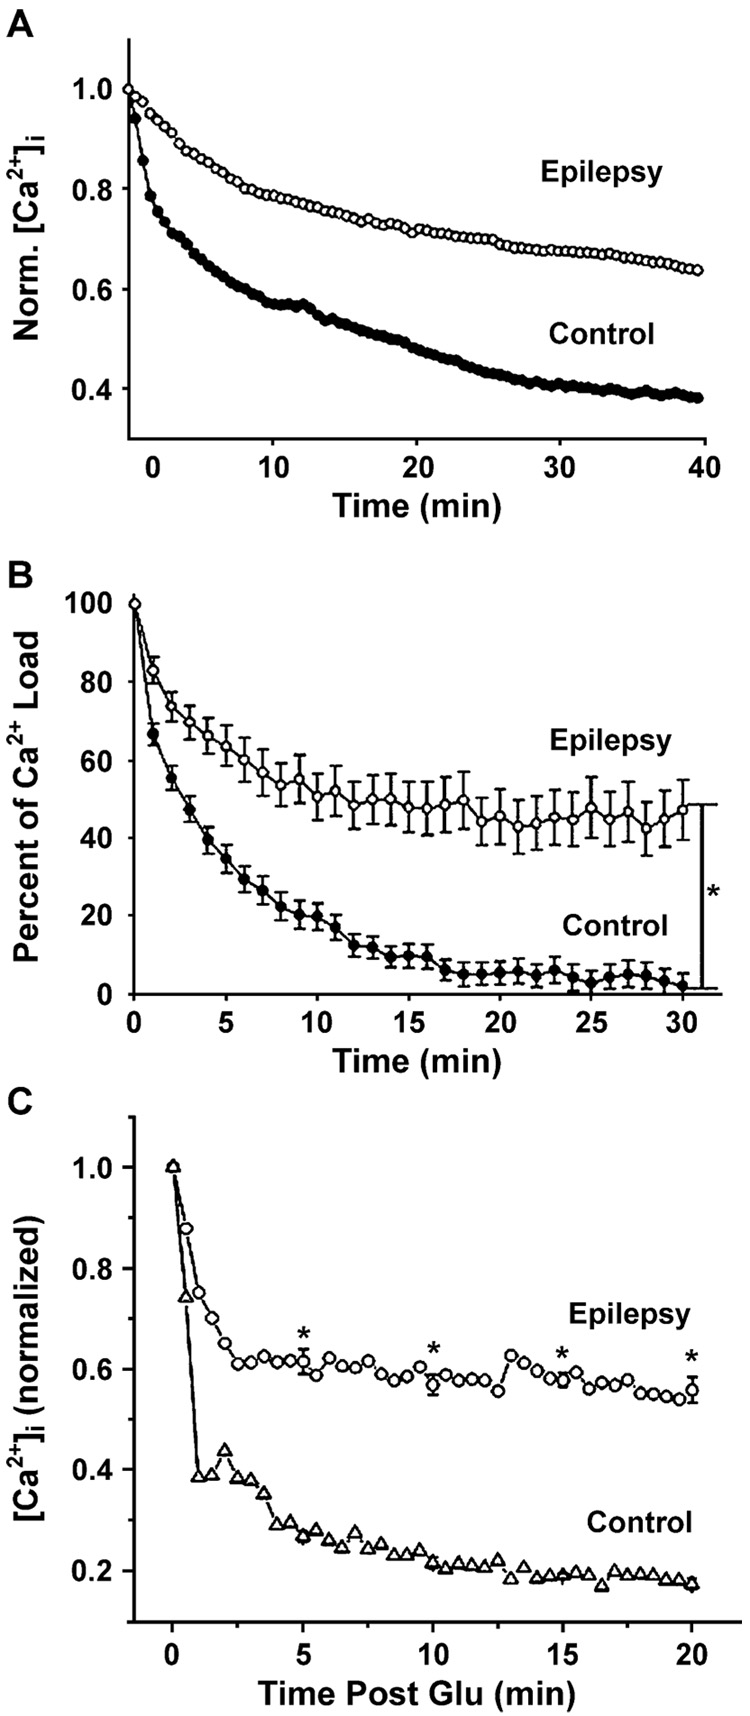
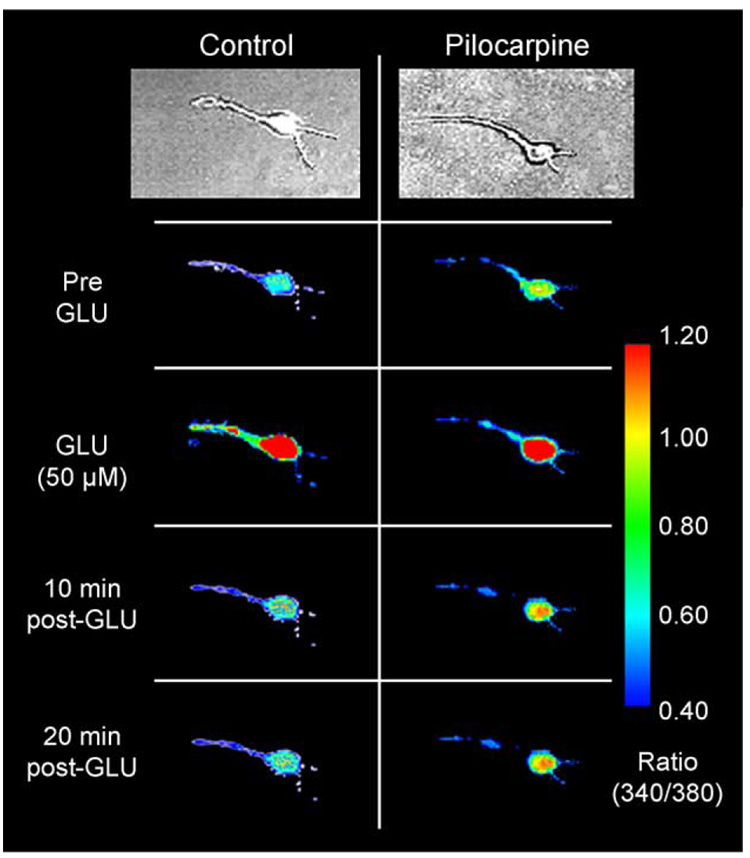
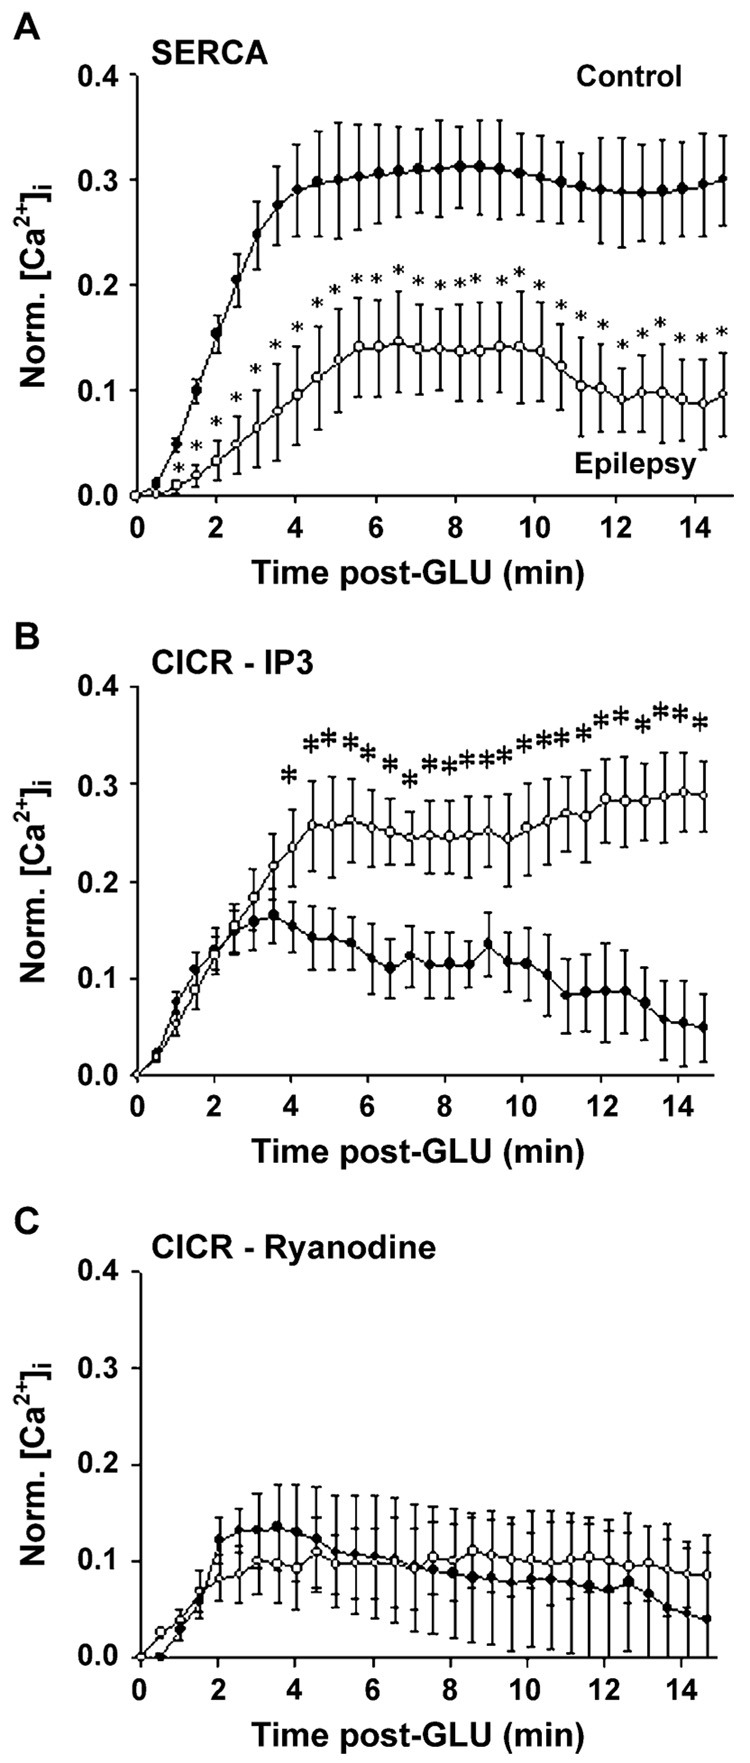
Epilepsy is one of the most common neurological disorders. Although epilepsy can be idiopathic, it is estimated that up to 50% of all epilepsy cases are initiated by neurological insults and are called acquired epilepsy (AE). AE develops in 3 phases: (1) the injury (central nervous system [CNS] insult), (2) epileptogenesis (latency), and (3) the chronic epileptic (spontaneous recurrent seizure) phases. Status epilepticus (SE), stroke, and traumatic brain injury (TBI) are 3 major examples of common brain injuries that can lead to the development of AE. It is especially important to understand the molecular mechanisms that cause AE because it may lead to innovative strategies to prevent or cure this common condition. Recent studies have offered new insights into the cause of AE and indicate that injury-induced alterations in intracellular calcium concentration levels [Ca(2+)](i) and calcium homeostatic mechanisms play a role in the development and maintenance of AE. The injuries that cause AE are different, but they share a common molecular mechanism for producing brain damage-an increase in extracellular glutamate concentration that causes increased intracellular neuronal calcium, leading to neuronal injury and/or death. Neurons that survive the injury induced by glutamate and are exposed to increased [Ca(2+)](i) are the cellular substrates to develop epilepsy because dead cells do not seize. The neurons that survive injury sustain permanent long-term plasticity changes in [Ca(2+)](i) and calcium homeostatic mechanisms that are permanent and are a prominent feature of the epileptic phenotype. In the last several years, evidence has accumulated indicating that the prolonged alteration in neuronal calcium dynamics plays an important role in the induction and maintenance of the prolonged neuroplasticity changes underlying the epileptic phenotype. Understanding the role of calcium as a second messenger in the induction and maintenance of epilepsy may provide novel insights into therapeutic advances that will prevent and even cure AE.


Figures

Fig. 1
Fig. 1
Simultaneous recording of epileptiform discharges and calcium dynamics during SE in the low-Mg2+-induced SE HNC model of AE. (A) Upper trace: a representative whole-cell current clamp recording from a neuron during SE. The neuron exhibited epileptiform-bursting activity consistent with continuous electrographic epileptiform activity. Each burst consisted of a large (30–40 mV) PDS with numerous superimposed spikes. Lower trace: simultaneous [Ca2+]i recording from the same neuron using ultra high-speed microfluorometry (5-msec resolution) demonstrating correlation between depolarization and elevations in [Ca2+]i. The [Ca2+]i level starts rising along with the subspike threshold waves of depolarization and level rises rapidly with the appearance of epileptiform bursts with numerous spikes. The comparison demonstrates that there is a direct correlation between elevated [Ca2+]i and continuous epileptiform discharges. (B) Expanded portion of a region indicated by the bar in panel A to demonstrate the relationship between each burst of action potential and the corresponding change in [Ca2+]i levels. The amplitude of spikes was truncated to emphasize the large PDS. The arrows denote the beginning of each PDS. Notice the brief time lag between the beginning of each epileptiform burst and the rise in calcium wave. Following each PDS, the [Ca2+]i could not recover to baseline levels before the next PDS occurred, and thus with each additional PDS, the [Ca2+]i gradually rose to a plateau level of ~600 nM (A). (Revised from Pal et al., 1999.)
Fig. 2
Fig. 2
Recovery of [Ca2+]i after various durations of SE in the Mg2+-induced SE HNC model of AE. Cells were treated with low Mg2+ to produce 15 min, 1 h, and 2 h of SE. The average [Ca2+]i in representative pyramidal cells (n = 5) was measured as described in Section 2. (A) Line graph of recovery time of [Ca2+]i to basal levels from the SE durations of 15 min, 1 h, and 2 h. Each line graph represents the average [Ca2+]i at each time point for 5 cells. (B) Quantitation of [Ca2+]i recovery time after various durations of SE. The data represent the mean ± SEM for recovery time after 15 min, 1 h, and 2 h of SE. There was a significant effect of SE duration on the recovery time between 15 min and 1 and 2 h of SE (*p < 0.05, Student’s t-test with Bonferroni correction. Revised from Pal et al., 1999.)
Fig. 3
Fig. 3
Direct evidence that increased [Ca2+]i occurs in the injury and epileptogenesis and chronic phases of AE in the pilocarpine model (A), and that inhibition of the NMDA receptor with MK801 during the injury induced by SE not only prevents the prolonged increase in [Ca2+]i (B) but also the development of AE (C). (A) Neurons were acutely isolated from hippocampal tissue during different times after the injury phase of AE. The data indicate that [Ca2+]i was significantly elevated immediately after SE and was still elevated as long as 1 year after the initial injury (*″p < 0.05). (B) The data present the mean ± SE [Ca2+]i for control (n = 35), pilo no SE (n = 21), 1 day after SE (n = 67), and 1 day after SE + MK801 (n = 29). MK801 blocked the development of increased [Ca2+]i after the SE injury (*p < 0.01, in comparison to control). (C) The data present, the percent animals that developed seizures at 60 days post-SE or control treatment in the control (n = 20), pilo no SE (n = 24), SE (n = 30), and SE + MK801 animals (n = 15). MK801 blocked the development of AE. (*p < 0.01, in comparison to control. Modified from Raza et al., 2004.)
Fig. 4
Fig. 4
Effects of glutamate injury on hippocampal membrane potential (A and B), input resistance (C), and cell swelling (D–F). (A) Representative whole-cell current clamp recording of a hippocampal neuron before, during, and after glutamate application (5 µM, 30 min). In the presence of glutamate (black bar), this neuron depolarized from −52 to −17 mV, and synaptic potentials were lost. Upon washout, the neuron repolarized to −47 mV and EPSPs returned. (B) Effect of glutamate on neuronal membrane potential. Neuronal membrane potential before (Before, n = 12), during (GLU, n = 12), and 5 min or more after glutamate application (wash, n = 19). *p < 0.05 ANOVA, Tukey post hoc test. (C) Effect of glutamate on neuronal membrane input resistance. Neuronal membrane input resistance before (Before, n = 10), during (GLU, n = 10), and 5 min or more after glutamate application (wash, n = 10). *p < 0.05 RM ANOVA, Tukey post hoc test. Data are represented by mean ± SEM. (D–F) Glutamate-induced neuronal swelling. Digital images of a representative fluorescein-stained, hippocampal pyramidal shaped neuron before (D), during glutamate exposure (5 µM, 30 min; E), and within 1 hr of glutamate washout (F). In glutamate, this neuron swelled, increasing somatic area by 31%. The same neuron within an hour of washout restored preexposure morphology, only 4% greater than preexposure somatic area. Scale bar = 10 µM. (From Sun et al., 2001.)
Fig. 5
Fig. 5
Hippocampal depth electrode EEG recordings from representative control (A) and epileptic (B and C) animals 2 months after vehicle or pilocarpine injections. (A) Control animals demonstrate normal background EEG rhythms. (B) Epileptic animals consistently manifested interictal spike discharges during EEG recordings; a typical seizure record is shown. Rapid spike discharges with frequencies between 10 and 20 Hz (region 1), followed by well-formed polyspike and slow wave discharges (region 2) were typically observed (C), and corresponded in time to the tonic and clonic phases of the clinical seizure activity that was observed on the video EEG. (From Rice et al., 1996.)
Fig. 6
Fig. 6
Induction of continuous seizure activity (status epilepticus) in cultured hippocampal neurons for 3 hr in the presence and the absence of several neuropharmacological agents. Intracellular recordings were obtained from hippocampal pyramidal neurons before, during, and after a 3-hr low-Mg2+ treatment employing established procedures. The recordings shown were representative of more than 10 independent experiments for each condition. (A) A representative intracellular recording from a control neuron showing occasional spontaneous action potentials. The resting potential of individual neurons ranged from 65 to 50 mV. Recording from more than 100 control neurons, no spontaneous seizure activity was observed. (B–J) Representative intracellular recordings during low-Mg2+ treatment in normal (2 mM; B) or low (0.2 mM) Ca2+ (C), or various neuropharmacological agents (see Fig. 2D–J). During the low-Mg2+ treatment, the cells developed longer-duration synaptic potentials and multiple-action potentials, evolving into continuous tonic high-frequency (4–20 Hz) burst discharges. The frequency of burst discharges varied from cell to cell. However, all the conditions shown in panels C–J manifested 3 hr of continuous seizure discharge. The low Ca2+ 0.2 mM (C), APV 25 µM (E), and MK801 10 µM (F) treatments consistently produced higher-frequency discharges. NBQX 10 µM (H) and 5 µM nifedipine (J) produced slightly lower-frequency discharges. After readdition of normal Mg2+ levels to the medium, all spontaneous continuous discharges attenuated. SE produced less than 10% neuronal cell death under these conditions. (From DeLorenzo et al., 1998.)
Fig. 7
Fig. 7
Induction of spontaneous recurrent seizures in cultured hippocampal neurons 2 days after low-Mg2+ treatment in the presence or the absence of low Ca2+ (C) or neuropharmacological agents (D–J) during the brief 3-hr exposure to low Mg2+. After low-Mg2+ treatment, cultures immediately were returned to normal Mg2+ levels in the media. Intracellular recordings were obtained from hippocampal pyramidal neurons 2 days after low-Mg2+ treatment. The recordings shown were representative of more than 10 independent experiments for each condition. SREDs (seizures) were observed under standard conditions, 2 mM Ca2+ (B), 10 µM CNQX (G), 10 µM NBQX (H), 250 µM MCPG (I), and 5 µM nifedipine (J). Low extracellular Ca2+ (0.2 mM; C) or intracellular chelation of Ca2+ with 100 µM BAPTA (D) during low-Mg2+ treatment completely blocked the development of spontaneous recurrent seizures despite causing even a higher-frequency seizure discharge during the low-Mg2+ treatment. Expansion of a 5-sec interval of seizure activity in panel B demonstrated the numerous spikes associated with each epileptiform burst. More than 80 spike discharges occurred during this 5-sec segment, giving an average spike frequency discharge of 16 Hz during this segment of the seizure shown in (B). The electrophysiological patterns for conditions A–J were representative of recordings taken earlier or later than the 2-day post-SE sample time. Conditions that blocked the induction of spontaneous recurrent seizures never manifested seizure discharges. (From DeLorenzo et al., 1998.)
Fig. 8
Fig. 8
[Ca2+]i imaging of hippocampal neurons in culture before, during, and after low-Mg2+ treatment in the presence or the absence of low Ca2+ or various neuropharmacological agents. (A) A representative hippocampal neuron under conditions with basal [Ca2+]i levels of 150 nM. (B) The same neuron shown in A during low-Mg2+ treatment. [Ca2+]i rose to 570 nM. (C) The same neuron shown in panels A and B after return to normal Mg2+ conditions after 3 hr of treatment. [Ca2+]i returned to near-basal conditions. Neurons remained viable for as long as 8–12 hr during Ca2+-imaging studies. Panels D–I represent groups of neurons during low-Mg2+ treatment with normal (2 mM; D) or low Ca2+ (0.2 mM; E), or the presence of 100 µM BAPTA (F), 10 µM MK801 (G), 10 µM CNQX (H), and 5 µM nifedipine (I). The calibration bar provides a direct comparison of color intensity and [Ca2+]i levels in nM. (From DeLorenzo et al., 1998.)
Fig. 9
Fig. 9
Effect of epileptogenesis on hippocampal neuronal [Ca2+]i levels in control and epileptic neurons in the chronic epilepsy phase of AE in the SE-induced HNC (A), stroke-induced HNC (B), and the pilocarpine (C) models of AE. (A) Induction of SREDs caused increased [Ca2+]i levels in the nucleus and cytosol of hippocampal neurons. Ratio values (405/485 nm) were obtained with Indo-1 using the point scan mode of the ACAS confocal fluorescence microscope. The ratio values shown are representative of 100-msec scans for a 2-min period. Baseline [Ca2+]i levels in both the nucleus and cytosol of control neurons were low. Neurons undergoing SREDs exhibited a statistically significant increase in the basal [Ca2+]i in both the nucleus (*p < 0.001, Student’s t-test) and cytosol (*p < 0.001, Student’s t-test) for the life of the neurons in culture. (From Pal et al., 1999.) (B) Epileptiform activity contributed, in part, to the chronic elevations in basal [Ca2+]i measured 5 days after glutamate injury-induced epileptogenesis. Blockade of epileptiform activity by 600 nM TTX significantly reduced the long-lasting elevations in basal [Ca2+]i in epileptic neurons (n = 99) in comparison to epileptic neurons (n = 94) exhibiting SREDs. Basal [Ca2+]i in epileptic neurons (n = 99) was still significantly elevated compared to control neurons (n = 71) in the presence of 600 nM TTX (*p < 0.05, Student’s t-test). Data are represented by mean ± SEM. (Modified from Sun et al., 2002.) (C) Induction of epileptogenesis caused increased basal [Ca2+]i levels in neurons acutely isolated from animals subjected to pilocarpine-induced temporal lobe epilepsy. Absolute [Ca2+]i levels in control and epileptic neurons were obtained after using a calibration curve for the Fura-2 Ca2+ indicator. Baseline [Ca2+]i levels in both control and epileptic CA1 hippocampal neurons were low. Epileptic neurons exhibited a statistically significant increase (*p < 0.005, n = 171 for control and n = 164 for the epileptic neurons) in the basal [Ca2+]i at 1 year after induction of epileptogenesis. (Modified from Raza et al., 2001.)
Fig. 10
Fig. 10
Comparison of [Ca2+]i recovery after a glutamate-induced calcium load in control and epileptic neurons in the SE-induced HNC (A), stroke-induced HNC (B), and the pilocarpine (C) models of AE. (A) Delayed recovery of [Ca2+]i levels in “epileptic” neurons in the SE HNC model of AE compared to control neurons in culture after a [Ca2+]i load produced by a 2-min exposure of 50 µM glutamate using low-affinity (Fura-FF) calcium indicators. (Modified from Pal et al., 2001.) Control and “epileptic” neurons exposed to glutamate under standard conditions. Figure represents the Fura-FF normalized average decay curves for control (n = 45) and “epileptic” (n = 45) neurons, respectively. The inability to restore resting [Ca2+]i levels in the “epileptic” neurons compared to control neurons was evident in these combined plots. Individual curves were smoothed and averaged, and the resultant decay curves from the highest point after 2 min of glutamate exposure are displayed. The “epileptic” cells showed statistically significantly delayed decline in [Ca2+]i compared to the control cells at 0.5 min fixed time points with both high- and low-affinity indicators ( p < 0.05, ANOVA, n = 45). (B) Impaired handling of glutamate-induced Ca2+ loads in epileptic neurons from the stroke HNC model of AE demonstrated by Ca2+ decay curves normalized as percent of the Ca2+ load induced during the glutamate exposure (Sun et al., 2004). The percent of Ca2+ load remaining at all time points after glutamate washout (time post-GLU) was significantly higher in epileptic neurons (n = 44; white) compared to control neurons (n = 43; black). *p < 0.01, multivariate ANOVA. Data are represented by mean ± SEM. (C) [Ca2+]i decay curves for the control and epileptic neurons acutely isolated from the hippocampus in the pilocarpine model of AE after a high[Ca2+]i load (50 µM glutamate for 1 min) using Fura-FF. (Modified from Raza et al., 2001.) The epileptic cells demonstrated a delayed recovery, which was statistically significantly higher than in the controls (*p < 0.002, n = 12 for controls and n = 9 for epileptics). Moreover, this delayed recovery was pronounced compared to the recovery with either the 5 or the 10 M glutamate stimuli. Recovery of [Ca2+]i levels was not evident until about 40-min postglutamate exposure (data not shown).
Fig. 11
Fig. 11
Pseudocolor fluorescent optical images of representative control and epileptic acutely isolated neurons from the pilocarpine model of AE before, during, and after the 50 µM glutamate exposure for 1 min utilizing the low-affinity Ca2+ indicator Fura-FF. (Modified from Raza et al., 2001.) As seen for the other treatments, basal [Ca2+]i levels were low in both the control and the epileptic neurons and rose rapidly during the glutamate exposure to high levels (~5 µM [Ca2+]i). While the control CA1 neurons were near preglutamate levels 10 min after glutamate exposure, the epileptic neurons exhibited high [Ca2+]i levels at that time point. Twenty minutes after the initial [Ca2+]i load, control cells had completely returned to basal levels of [Ca2+]i, while the [Ca2+]i levels in the epileptic cells did not reach baseline levels. The epileptic cells did not recover even after 40-min postglutamate exposure (data not shown). The top 2 panels display the phase micrographs of the representative control and epileptic neurons. The data shown were representative of 15 experiments.
Fig. 12
Fig. 12
Activity of SERCA (A), CICR-IP3 (B), and CICR-Ryanodine (C) in control and epileptic neurons in the chronic epilepsy phase of AE in the SE-induced HNC model of AE. (Modified from Pal et al., 2001.) (A) SERCA activity in control and epileptic neurons. The results indicate epileptogenesis-inhibited SERCA activity. The data represent the means ± SE of the mean differences between the curves. These differences in means between the control and the “epileptic” curves were statistically significant (*p < 0.05, Hoteling’s T2-test). (B) Contribution of IP3 CICR activity to the delayed recovery of [Ca2+]i levels in normal and “epileptic” cells following a 50 µM glutamate [Ca2+]i load. IP3 CICR activity estimated for control and epileptic neurons. The curves indicate a much more augmented 2APB-inhibited release mechanism in the “epileptic” neurons compared to the control neurons. This release is an estimate of the IP3 receptor-activated CICR from the ER. The data represent the means ± SE of the mean differences between the curves. These differences in means between the control and the “epileptic” curves were statistically significant (*p < 0.05, Hoteling’s T2-test). (C) Contribution of ryanodine CICR activity to the delayed recovery of [Ca2+]i levels in normal and “epileptic” cells following a 50 µM glutamate [Ca2+]i load. Ryanodine CICR activity estimated for control and epileptic neurons. The curves indicate similar dantrolene-inhibited release in both control and “epileptic” neurons. This release represents the ryanodine receptor-activated CICR from the ER. The data represent the means ± SE of the mean differences between the curves. These differences in means between the control and the “epileptic” curves were not statistically significant (Hoteling’s T2-test).

References

    1. Aarts M, Iihara K, Wei WL, Xiong ZG, Arundine M, Cerwinski W, et al. A key role for TRPM7 channels in anoxic neuronal death. Cell. 2003;115(7):863–877. - PubMed
    1. Abel T, Lattal KM. Molecular mechanisms of memory acquisition, consolidation and retrieval. Curr Opin Neurobiol. 2001;11(2):180–187. - PubMed
    1. Adams ME, Olivera BM. Neurotoxins: overview of an emerging research technology. Trends Neurosci. 1994;17(4):151–155. - PubMed
    1. Akasu T, Muraoka N, Hasuo H. Hyperexcitability of hippocampal CA1 neurons after fluid percussion injury of the rat cerebral cortex. Neurosci Lett. 2002;329(3):305–308. - PubMed
    1. Albensi BC. Models of brain injury and alterations in synaptic plasticity. J Neurosci Res. 2001;65(4):279–283. - PubMed

Publication types