. 2005 Mar;125(3):257-71.
doi: 10.1085/jgp.200409177.

Phosphorylation of titin modulates passive stiffness of cardiac muscle in a titin isoform-dependent manner

Affiliations

Phosphorylation of titin modulates passive stiffness of cardiac muscle in a titin isoform-dependent manner

Norio Fukuda et al. J Gen Physiol. 2005 Mar.

Abstract

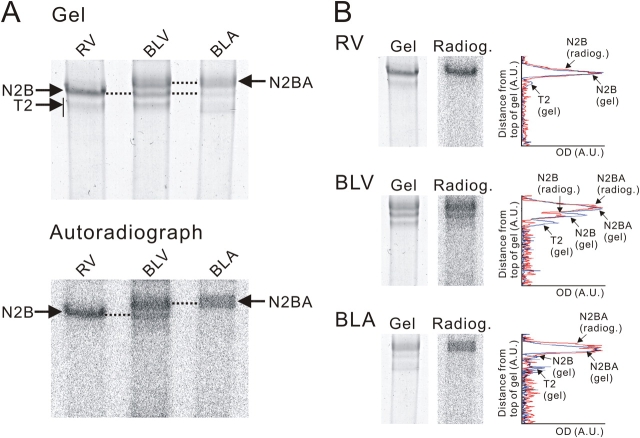
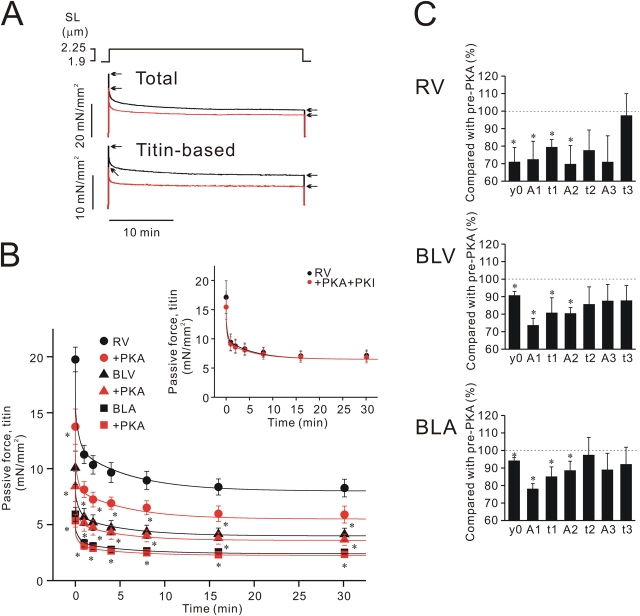
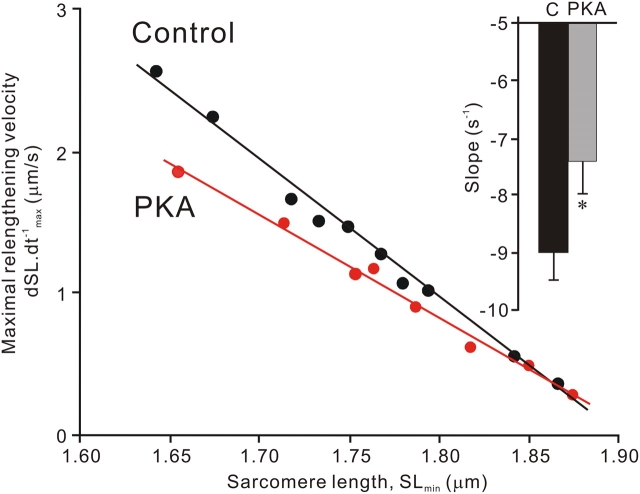
We investigated the effect of protein kinase A (PKA) on passive force in skinned cardiac tissues that express different isoforms of titin, i.e., stiff (N2B) and more compliant (N2BA) titins, at different levels. We used rat ventricular (RV), bovine left ventricular (BLV), and bovine left atrial (BLA) muscles (passive force: RV > BLV > BLA, with the ratio of N2B to N2BA titin, approximately 90:10, approximately 40:60, and approximately 10:90%, respectively) and found that N2B and N2BA isoforms can both be phosphorylated by PKA. Under the relaxed condition, sarcomere length was increased and then held constant for 30 min and the peak passive force, stress-relaxation, and steady-state passive force were determined. Following PKA treatment, passive force was significantly decreased in all muscle types with the effect greatest in RV, lowest in BLA, and intermediate in BLV. Fitting the stress-relaxation data to the sum of three exponential decay functions revealed that PKA blunts the magnitude of stress-relaxation and accelerates its time constants. To investigate whether or not PKA-induced decreases in passive force result from possible alteration of titin-thin filament interaction (e.g., via troponin I phosphorylation), we conducted the same experiments using RV preparations that had been treated with gelsolin to extract thin filaments. PKA decreased passive force in gelsolin-treated RV preparations with a magnitude similar to that observed in control preparations. PKA was also found to decrease restoring force in skinned ventricular myocytes of the rat that had been shortened to below the slack length. Finally, we investigated the effect of the beta-adrenergic receptor agonist isoprenaline on diastolic force in intact rat ventricular trabeculae. We found that isoprenaline phosphorylated titin and that it reduced diastolic force to a degree similar to that found in skinned RV preparations. Taken together, these results suggest that during beta-adrenergic stimulation, PKA increases ventricular compliance in a titin isoform-dependent manner.


Figures

F<sc>igure</sc> 1.
Figure 1.
Titin phosphorylation in various muscle types. (A) Top, CBB-stained gel of solubilized RV, BLV, and BLA preparations incubated with [γ-32P]ATP in the presence of PKA; bottom, 24-h autoradiographic exposure. Note phosphorylation of T1 of N2B and N2BA titins and no phosphorylation of T2. (B) Side-by-side comparison of gel and autoradiograph and densitometric scan of gel (blue) and autoradiograph (red) for RV, BLV, and BLA.
F<sc>igure</sc> 2.
Figure 2.
Effect of PKA on passive force in various types of skinned cardiac muscle. (A) Typical chart recording showing the effect of PKA on total and titin-based passive force in RV. SL was increased from 1.90 to 2.25 μm as indicated. Black, before PKA; red, after PKA. Titin-based passive force was obtained by subtracting collagen-based passive force from total passive force. Arrows indicate the onset and end of stress-relaxation. (B) Effect of PKA on titin-based passive force in RV, BLV, and BLA. SL was increased from 1.90 to 2.25 μm. The values of maximal Ca2+-activated force before PKA treatment were 51.52 ± 8.53, 26.08 ± 2.56, and 18.42 ± 1.63 mN/mm2 in RV, BLV, and BLA, respectively (at SL 1.90 μm). Data obtained from each preparation (see A for example) were fitted to three exponential decays as described in text, and curves with mean values of exponential parameters are shown (compare Table I). RV, n = 6; BLV, n = 6; BLA, n = 8. Inset, effect of PKA+PKI on titin-based passive force in RV preparations (SL increased from 1.90 to 2.25 μm; n = 6). PKA+PKI does not significantly affect passive force. (C) Summary of stress-relaxation measurements. Percent changes compared with pre-PKA values (offsets, amplitudes, and time constants) are shown. *, P < 0.05 compared with pre-PKA values.
F<sc>igure</sc> 3.
Figure 3.
Effect of PKA on passive force at the upper limit of the physiological SL range in BLV and BLA. (A) Titin-based passive force before and after PKA treatment in BLV and BLA. SL was increased from 1.90 to 2.40 μm. The values of maximal Ca2+-activated force before PKA treatment were 27.49 ± 2.93 and 19.48 ± 1.62 mN/mm2 in BLV and BLA, respectively (at SL 1.90 μm). Data fitted to three exponential decays (compare Table I). BLV, n = 8; BLA, n = 8. (B) Summary of stress-relaxation measurements. *, P < 0.05 compared with pre-PKA values.
F<sc>igure</sc> 4.
Figure 4.
SL dependence of the effect of PKA on passive force. Percent reduction is shown. (A) SL dependence for peak force. Data fitted to linear regression line. Left, total passive force. The slopes are −55.10 (R2 = 0.98; P < 0.05), −14.56 (R2 = 0.97; P < 0.01), and −6.65 (R2 = 0.98; P < 0.005), for RV, BLV, and BLA, respectively. Right, titin-based passive force. The slopes are −92.20 (R2 = 0.99; P < 0.05), −12.49 (R2 = 0.91; P < 0.05), and −4.25 (R2 = 0.94; P < 0.05), for RV, BLV, and BLA, respectively. (B) SL dependence for steady-state passive force (data obtained 30 min after stretch). Left, total passive force. The slopes are −38.61 (R2 = 0.98; P < 0.01), −6.69 (R2 = 0.97; P < 0.05), and −5.58 (R2 = 0.89; P < 0.05), for RV, BLV, and BLA, respectively. Right, titin-based passive force. The slopes are −30.64 (R2 = 0.99; P < 0.05), −5.10 (R2 = 0.89; P < 0.05), and −3.29 (R2 = 0.92; P < 0.05), for RV, BLV, and BLA, respectively. *, P < 0.05 compared with BLA; #, P < 0.05 compared with BLV. n = 6–8.
F<sc>igure</sc> 5.
Figure 5.
Effect of PKA on passive force in gelsolin-treated RV preparations. (A) Typical chart recording showing the effect of PKA on total and titin-based passive force. SL was increased from 1.90 to 2.25 μm as indicated. Black, before PKA; red, after PKA. Titin-based passive force was obtained by subtracting collagen-based passive force from total passive force. Arrows indicate the onset and end of stress-relaxation. (B) Summarized data from six preparations showing the effect of PKA on titin-based passive force. SL was increased from 1.90 to 2.25 μm. The value of maximal Ca2+-activated force before PKA treatment was 3.12 ± 1.38 mN/mm2 (at SL 1.90 μm). Data fitted to three exponential decays (compare Table I). (C) Bar graph comparing the PKA-induced decreases in passive force in control (C; data taken from Fig. 2 B) and gelsolin-treated preparations (G). No significant differences were observed (NS). (D) Summary of stress-relaxation measurements. *, P < 0.05 compared with pre-PKA values.
F<sc>igure</sc> 6.
Figure 6.
Effect of PKA treatment on relengthening velocity of skinned rat ventricular myocytes following rigor contraction to below the slack length. Examples of the relationship between maximum relengthening velocity (dSL.dt−1 max) and the minimum SL (SLmin) in control (black) and PKA-treated myocytes (red). The relationship of dSL.dt−1 max vs. SLmin is fitted well with a linear regression line (R2 > 0.95). Inset, bar graph showing slopes of dSL.dt−1 max vs. SLmin relationship of 93 control myocytes (from 12 animals) and 71 PKA-treated myocytes (from 10 animals). C, control (no PKA). *, P < 0.05 compared with control.
F<sc>igure</sc> 7.
Figure 7.
Effect of β-adrenergic stimulation on systolic and diastolic properties of intact RV preparations. (A) Typical chart recording showing the effect of 1 μM isoprenaline (ISO). Top, effect of isoprenaline on twitch contractions at the slack SL (∼1.90 μm). Middle, twitch contractions at different lengths before (left) and after (right) isoprenaline. For this preparation, SL was varied from 1.904 to 2.205 μm and from 1.902 to 2.201 μm before and after isoprenaline, respectively. Bottom, changes in diastolic force are shown on a larger scale. Diastolic force is decreased by isoprenaline (arrows indicate diastolic force for the last three stretches). (B) Top, the effect of isoprenaline on developed force. Data from each preparation were fitted by a linear regression line (for each set of data, R > 0.97; P < 0.0001). Developed force was increased with isoprenaline, especially at the long SL range, and, consequently, the slope of the linear regression line was significantly increased (P < 0.05). Before isoprenaline: y = 167.85x − 312.05. After isoprenaline: y = 270.70x − 505.93. Bottom, the effect of isoprenaline on diastolic force. Data fitted to an exponential function as described in text. The values at the longest SL (seventh step in the protocol) are as follows. Developed force, 56.84 ± 4.98 and 82.97 ± 8.97 mN/mm2 (P < 0.05), before and after isoprenaline, respectively. Diastolic force, 7.93 ± 1.26 and 6.22 ± 1.11 mN/mm2 (P < 0.05), before and after isoprenaline, respectively. SL, 2.17 ± 0.01 before and after isoprenaline. n = 6. (C) Data showing reproducibility of developed and diastolic force without isoprenaline. Top, developed force. First protocol: y = 124.89x − 219.14. Second protocol: y = 125.89x − 223.75. Slopes are not significantly different. Bottom, diastolic force. k: 8.18 ± 0.65 and 8.21 ± 0.89, respectively, in the first and second protocols (P > 0.05). SL0: 1.88 ± 0.02 and 1.88 ± 0.03 μm, respectively, in the first and second protocols (P > 0.05). Neither parameter is significantly different between first and second protocols. The values at the longest SL (seventh step in the protocol) are as follows. Developed force, 49.28 ± 4.89 and 47.63 ± 5.05 mN/mm2 (P > 0.05), in the first and second protocols, respectively. Diastolic force, 7.84 ± 0.60 and 7.87 ± 0.48 mN/mm2 (P > 0.05), in the first and second protocols, respectively. SL, 2.16 ± 0.01 for first and second protocols. n = 6.
F<sc>igure</sc> 8.
Figure 8.
Effect of propranolol and carbamyl choline (Pro) and isoprenaline (ISO) on titin and MyBP-C phosphorylation by using the back phosphorylation assay. Intact rat right ventricular trabeculae were treated with Pro or ISO, followed by skinning and incubation with [γ-32P]ATP in the presence of PKA. (A) Gel and corresponding autoradiograph for titin (top) and MyBP-C bands (bottom). Each sample was electrophoresed with four different loadings (two loadings are shown here). Integrated OD was determined for each band and plotted against loading volume. (B) Pro vs. ISO slope ratio determined from autoradiographs after correction for protein loading differences between Pro and ISO-treated samples. Results indicate significantly less 32P incorporation after ISO treatment in titin as well as in MyBP-C.

Comment in

References

    1. Bers, D.M. 2001. Excitation-Contraction Coupling and Cardiac Contractile Force. Second edition. Kluwer-Academic, Dordrecht, Netherlands. 427 pp.
    1. Bers, D.M. 2002. Cardiac excitation–contraction coupling. Nature. 415:198–205. - PubMed
    1. Cazorla, O., A. Freiburg, M. Helmes, T. Centner, M. McNabb, Y. Wu, K. Trombitas, S. Labeit, and H. Granzier. 2000. Differential expression of cardiac titin isoforms and modulation of cellular stiffness. Circ. Res. 86:59–67. - PubMed
    1. Chiu, Y.L., E.W. Ballou, and L.E. Ford. 1982. Internal viscoelastic loading in cat papillary muscle. Biophys. J. 40:109–120. - PMC - PubMed
    1. de Tombe, P.P., and H.E.D.J. ter Keurs. 1991. Lack of effect of isoproterenol on unloaded velocity of sarcomere shortening in rat cardiac trabeculae. Circ. Res. 68:382–391. - PubMed

Publication types

MeSH terms