. 2005 Mar;125(3):273-86.
doi: 10.1085/jgp.200409239.

Divalent cation sensitivity of BK channel activation supports the existence of three distinct binding sites

Affiliations

Divalent cation sensitivity of BK channel activation supports the existence of three distinct binding sites

Xu-Hui Zeng et al. J Gen Physiol. 2005 Mar.

Abstract

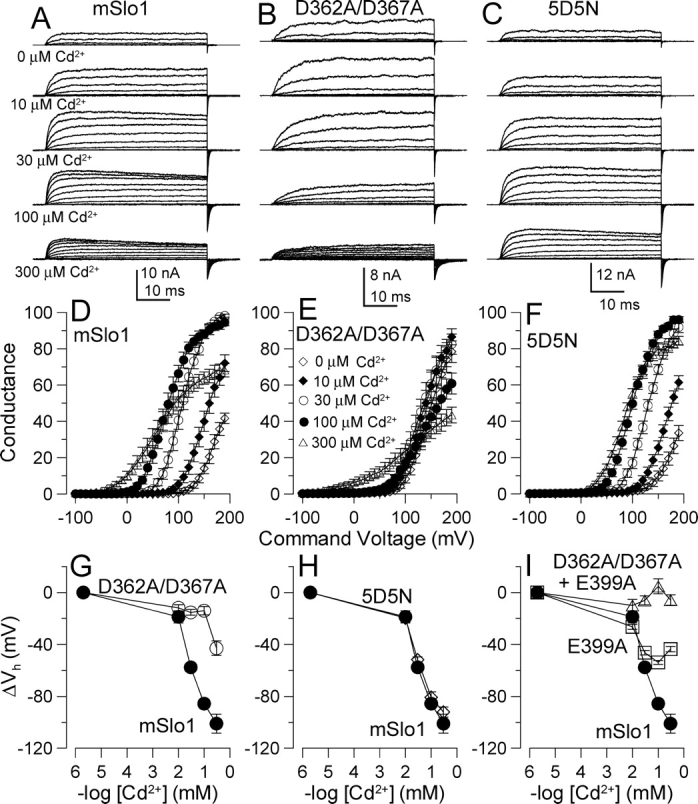
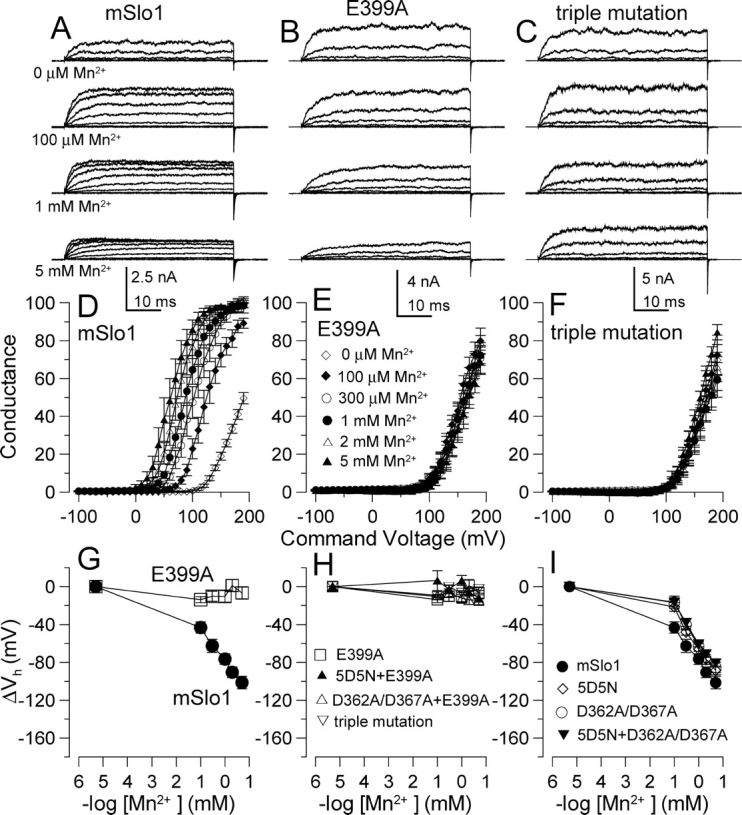
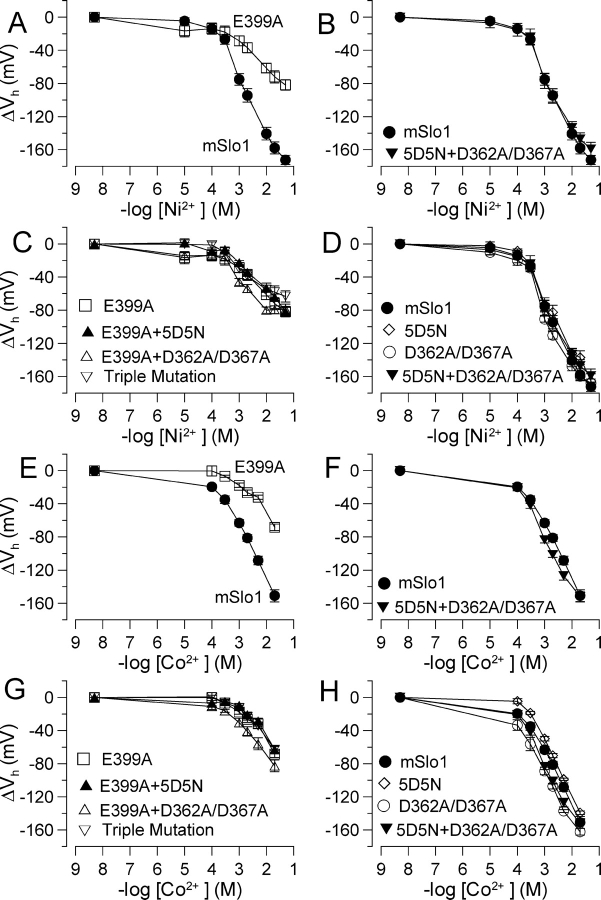
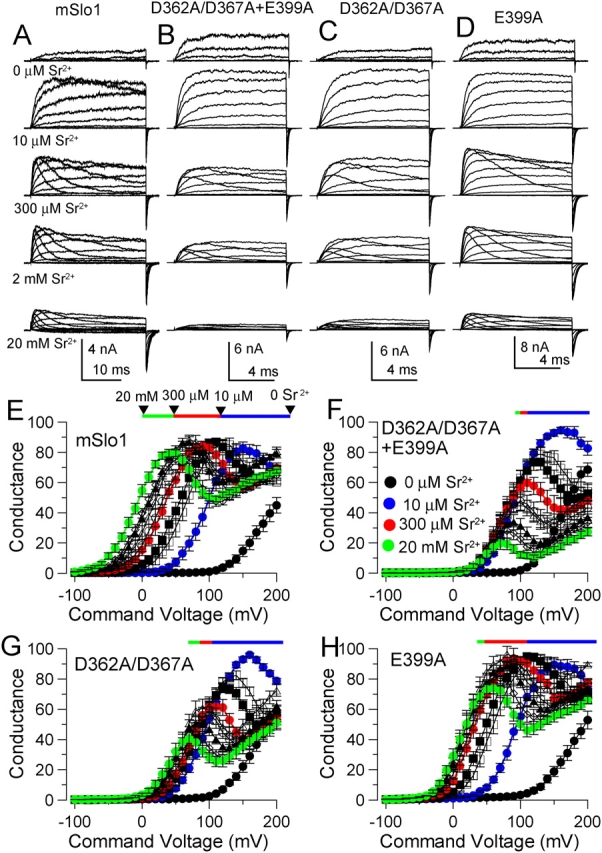
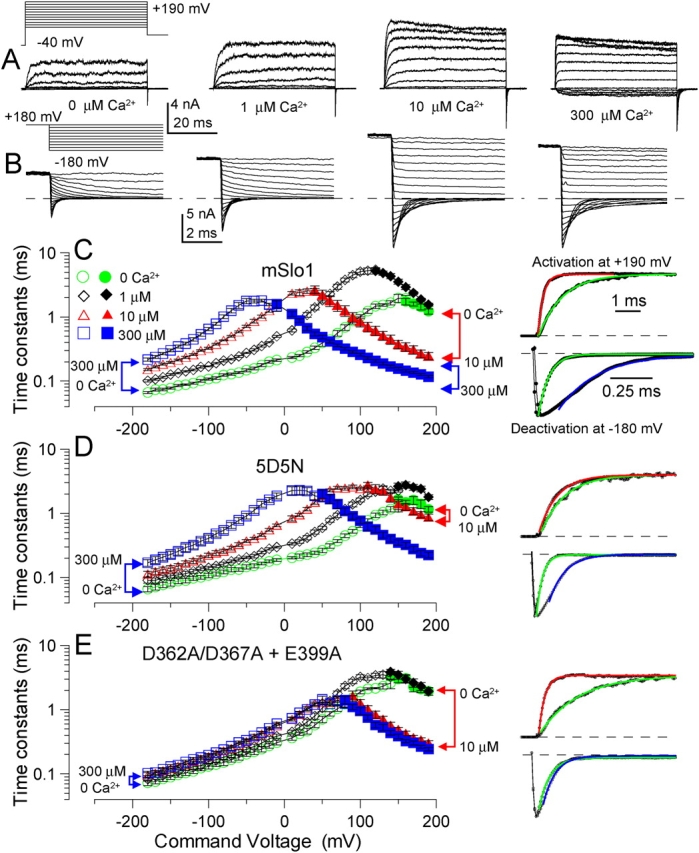
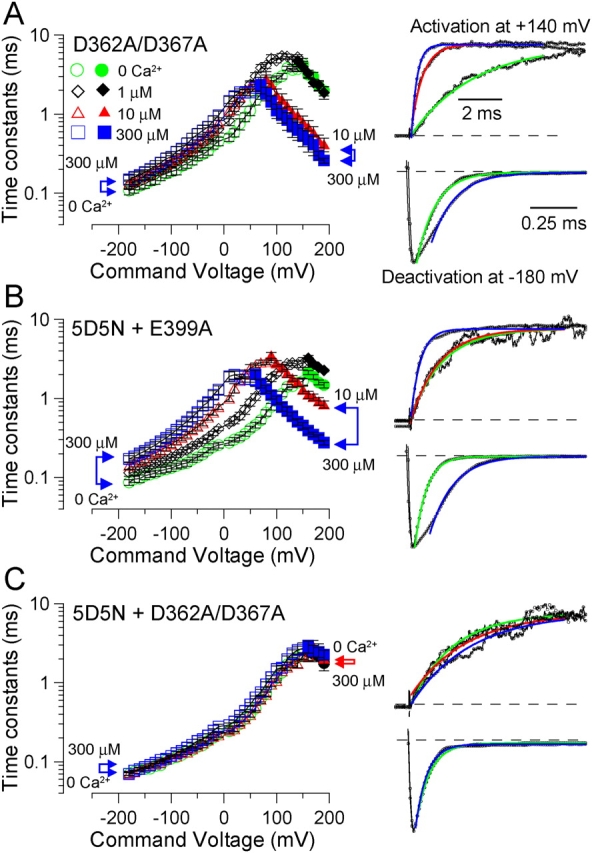
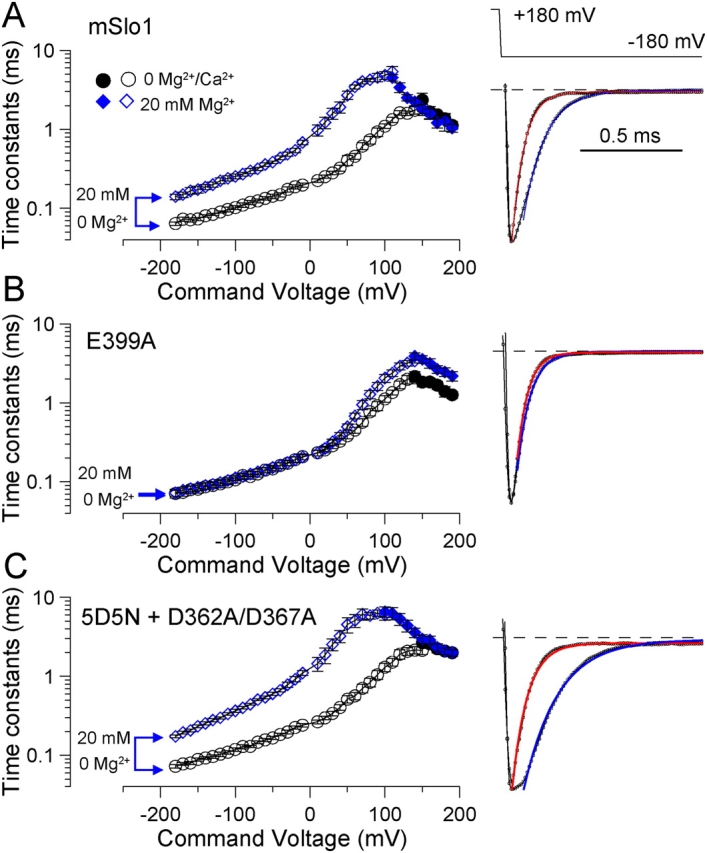
Mutational analyses have suggested that BK channels are regulated by three distinct divalent cation-dependent regulatory mechanisms arising from the cytosolic COOH terminus of the pore-forming alpha subunit. Two mechanisms account for physiological regulation of BK channels by microM Ca2+. The third may mediate physiological regulation by mM Mg2+. Mutation of five aspartate residues (5D5N) within the so-called Ca2+ bowl removes a portion of a higher affinity Ca2+ dependence, while mutation of D362A/D367A in the first RCK domain also removes some higher affinity Ca2+ dependence. Together, 5D5N and D362A/D367A remove all effects of Ca2+ up through 1 mM while E399A removes a portion of low affinity regulation by Ca2+/Mg2+. If each proposed regulatory effect involves a distinct divalent cation binding site, the divalent cation selectivity of the actual site that defines each mechanism might differ. By examination of the ability of various divalent cations to activate currents in constructs with mutationally altered regulatory mechanisms, here we show that each putative regulatory mechanism exhibits a unique sensitivity to divalent cations. Regulation mediated by the Ca2+ bowl can be activated by Ca2+ and Sr2+, while regulation defined by D362/D367 can be activated by Ca2+, Sr2+, and Cd2+. Mn2+, Co2+, and Ni2+ produce little observable effect through the high affinity regulatory mechanisms, while all six divalent cations enhance activation through the low affinity mechanism defined by residue E399. Furthermore, each type of mutation affects kinetic properties of BK channels in distinct ways. The Ca2+ bowl mainly accelerates activation of BK channels at low [Ca2+], while the D362/D367-related high affinity site influences both activation and deactivation over the range of 10-300 microM Ca2+. The major kinetic effect of the E399-related low affinity mechanism is to slow deactivation at mM Mg2+ or Ca2+. The results support the view that three distinct divalent-cation binding sites mediate regulation of BK channels.


Figures

F<sc>igure</sc> 1.
Figure 1.
Cd2+ confers high affinity regulatory effects only through the D362/D367 site. (A–C) Traces show currents from inside-out patches for Slo1 and indicated mutants with cytosolic [Cd2+]i as shown in A. Voltage steps were from −80 mV through to +160 mV in 20-mV increments following 40 ms at −180 mV, with tail currents at −120 mV. (D-F) G–V curves were generated over [Cd2+]i from 0 to 300 μM for Slo1 (n = 6), D362A/D367A (n = 7) and 5D5N (n = 6). Open diamonds, 0 μM; filled diamonds, 10 μM; open circles, 30 μM; filled circles, 100 μM; open triangles, 300 μM. Current amplitude is markedly reduced when [Cd2+]i is >300 μM (not depicted). (G) Activation ΔVh is plotted versus [Cd2+]i for wild-type Slo1 (n = 6) and for the construct with the D362A/D367A mutation (n = 7). (H) ΔVh is plotted versus [Cd2+] for Slo1 versus 5D5N (n = 6). (I) ΔVh is plotted versus [Cd2+] for Slo1 versus E399A (n = 7) and the combined mutation of D362A/D367A + E399A (n = 8).
F<sc>igure</sc> 2.
Figure 2.
The ability of Mn2+ to activate BK current depends on the E399 low affinity site. (A–C) Currents resulting from Slo1 (A), E399A (B), and the triple mutation (C, 5D5N + D362AD367A + E399A) were activated as in Fig. 1. (D–F) G–V curves were generated over [Mn2+]i from 0 to 5 mM for Slo1 (n = 6), E399A (n = 5), and the triple mutation (n = 5). Open diamonds, 0 μM; filled diamonds, 100 μM; open circles, 300 μM; filled circles, 1 mM; open triangles, 2 mM; filled triangles, 5 mM. (G) Activation ΔVh is plotted versus [Mn2+]i for Slo1 (n = 6) and E399A (n = 5). (H) Activation ΔVh is plotted versus [Mn2+]i for mutants containing E399A (5D5N + E399A, n = 4; D362A/D367A + E399A, n = 6; triple mutation, n = 5). (H) Activation ΔVh is plotted versus [Mn2+]i for Slo1 and mutants not containing E399A (5D5N, n = 5; D362A/D367A, n = 7; 5D5N + D362A/D367A, n = 8).
F<sc>igure</sc> 3.
Figure 3.
Effects of Ni2+ and Co2+ are disrupted by the E399A mutation. (A) Activation ΔVh is plotted as a function of [Ni2+]i for Slo1 (n = 4) and E399A (n = 6). (B) Activation ΔVh is plotted as a function of [Ni2+] for Slo1 and the construct with mutation of both high affinity sites (5D5N + D362A/D367A, n = 5). (C) Activation ΔVh is plotted as a function of [Ni2+]i for all mutants containing E399A (5D5N + E399A, n = 6; D362A/D367A + E399A, n = 5; triple mutation, n = 6). (D) Activation ΔVh is plotted as a function of [Ni2+] for all constructs with an intact E399 (5D5N, n = 5; D362A/D367A, n = 9; 5D5N + D362A/D367A, n = 5). (E–H) Activation ΔVh is plotted as a function of [Co2+] for combinations of constructs identical to those in A–D. mSlo1, n = 5; 5D5N, n = 5; D362A/D367A, n = 4; E399A, n = 4; 5D5N + D362A/D367A, n = 5; 5D5N + E399A, n = 6; D362A/D367A + E399A, n = 5; triple mutation, n = 4.
F<sc>igure</sc> 4.
Figure 4.
Sr2+ activates BK channels through all three mutationally defined sites. (A) Current activation by Sr2+ for Slo1 is shown for voltages up to +200 mV. Note the slow voltage-dependent block at [Sr2+] of 300 μM and higher. (B) Currents activated by Sr2+ in construct D362A/D367A+E399A are shown. Note the faster time based in B–D, in comparison to A. (C) Currents activated by Sr2+ in construct D362A/D367A are shown. (D) Currents activated by Sr2+ in channels containing the E399A mutation are shown. The stimulation protocol was similar to that in Fig. 1. (E–H) G–V curves were generated over [Sr2+]i from 0 to 20 mM for wild-type Slo1(E, n = 7), the mutant with only the intact Ca2+ bowl region (D362A/D367A + E399A, F, n = 7), D362A/D367A (G, n = 7), and E399A (H, n = 5). [Sr2+]i are as follows: filled circles, 0 μM; filled blue circles, 10 μM; open squares, 50 μM; filled squares, 100 μM; filled red circles, 300 μM; open circles, 1 mM; open triangles, 2 mM; filled triangles, 5 mM; open diamonds, 10 mM; filled green circle, 20 mM. G–V amplitudes were normalized to the maximal current amplitude at 10 μM Sr2+. The colored horizontal bar indicates the approximate shift in the G–V curve for increases in Sr2+ from 0 to 10 μM (blue), 10 to 300 μM (red), 300 μM to 20 mM (green), corresponding approximately to the contribution of the Ca2+ bowl (blue), D362/D367 (red), and E399 (green) to the effect of Sr2+.
F<sc>igure</sc> 5.
Figure 5.
The calcium bowl is mainly responsible for the acceleration of activation from 0 to 10 mM Ca2+. (A) Typical currents used for measurement of current activation time constants are shown for mSlo1 with 0, 1, 10, and 300 μM Ca2+ along with the voltage activation protocol. (B) Examples of Slo1 tail currents used for measurement of deactivation time constants are given for the indicated [Ca2+]. Voltage steps were from −180 to +180 mV in 20-mV increments (only every 40 mV is shown in the displayed protocol). (C) Activation (filled symbols) and deactivation (open symbols) time constants for Slo1 (n = 6) are plotted at various [Ca2+] showing the slower deactivation and faster activation produced by Ca2+. Traces on the right (top pair of traces) show normalized current activation at +190 mV with 0 μM Ca2+ (green line is fitted single exponential, 1.00 ms) and 10 μM Ca2+ (red fitted exponential, 0.227 ms). Bottom pair of right-hand traces show current deactivation at −180 mV for 0 μM Ca2+ (green fitted line, 0.041 ms) and 300 μM Ca2+ (blue fitted line, 0.107 ms). Both activation and deactivation examples are from the same patch. For activation time courses, only every 10th digitized current value is displayed. (D) Time constants are plotted as in C, but for 5D5N (n = 6). Traces on the right are identical in format to those in C. Activation τ: 0 Ca2+, 0.996 ms; 10 μM Ca2+, 0.771 ms. Deactivation t: 0 Ca2+, 0.041 ms; 300 μM Ca2+, 0.107 ms. (E) Time constants are plotted as in C, but for D362A/D367A + E399A (n = 8). Activation τ: 0 Ca2+, 1.61 ms; 10 μM Ca2+, 0.254 ms. Deactivation τ: 0 Ca2+, 0.074 ms; 10 μM Ca2+, 0.080 ms.
F<sc>igure</sc> 6.
Figure 6.
The D362/D367 site slows deactivation and accelerates activation in the range of 10 to 300 μM Ca2+. Activation and deactivation time courses were determined as in Fig. 5 at 0, 1, 10, and 300 μM Ca2+. (A) Effects of Ca2+ on activation and deactivation time constants are plotted as a function of command voltage for D362A/D367A (n = 6). Open symbols were measured from deactivation protocols and filled symbols from activation protocols. Representative normalized current traces for activation (at +190 mV) and deactivation (at −180 mV) are shown on the right, along with lines showing single exponential fits. Activation time constants: 0 Ca2+ (green), 1.74 ms; 10 μM Ca2+ (red), 0.34 ms; 300 μM Ca2+ (blue), 0.27 ms. Deactivation time constants: 0 Ca2+ (green), 0.104 ms; 300 μM Ca2+ (blue), 0.129 ms. (B) Time constants for the construct with both the Ca2+ bowl and E399 mutated (5D5N+E399A; n = 7) are plotted with representation current traces and fitted exponentials on the right. Activation time constants: 0 Ca2+, 1.22 ms; 10 μM Ca2+, 0.74 ms; 300 μM Ca2+, 0.26 ms. Deactivation time constants: 0 Ca2+, 0.065 ms; 300 μM Ca2+, 0.130 ms. (C) The dependence of activation and deactivation time constants is plotted at various Ca2+ for the construct with both higher affinity sites mutated (5D5N+D362A/D367A, n = 6) with sample traces and fitted single exponentials on the right. Activation time constants: 0 Ca2+, 1.69 ms; 10 μM Ca2+, 1.67 ms; 300 μM Ca2+, 2.91 ms. Deactivation time constants: 0 Ca2+, 0.079; 300 μM Ca2+, 0.631 ms.
F<sc>igure</sc> 7.
Figure 7.
The E399 low affinity site slows deactivation. Activation and deactivation time courses were determined as in Fig. 5 but either in the absence or presence of 20 mM Mg2+. (A) Effect of 20 mM Mg2+ on activation time constants or deactivation time constants in wild-type Slo1 (n = 6). Open symbols, deactivation; filled symbols, activation. Traces on the right show normalized deactivation currents at −180 mV with either 0 Mg2+ (red fitted line, 0.061 ms) or 20 mM Mg2+ (blue fitted line, 0.107 ms). (B) Effect of 20 mM Mg2+ on activation and deactivation time constants with the E399A mutation (n = 7). Traces on the right are as in A. τd: 0 μM Mg2+, 0.055 ms; 20 mM Mg2+, 0.066 ms. (C) Effect of 20 mM Mg2+ in the construct with both higher affinity sites mutated (5D5N+D362A/D367A; n = 7). Traces on the right are as in A. τd: 0 μM Mg2+, 0.076 ms; 20 mM Mg2+, 0.170 ms. Circles, 0 μM Mg2+; diamonds, 20 mM Mg2+.

Comment in

Similar articles

Cited by

References

    1. Bao, L., C. Kaldany, E. Holmstrand, and D. Cox. 2004. Mapping the BKCa channel's “Ca2+ bowl”: side-chains essential for Ca2+ sensing. J. Gen. Physiol. 123:475–489. - PMC - PubMed
    1. Bao, L., A. Rapin, E. Holmstrand, and D. Cox. 2002. Elimination of the BKCa channel's high affinity Ca2+ sensitivity. J. Gen. Physiol. 120:173–189. - PMC - PubMed
    1. Barrett, J.N., K.L. Magleby, and B.S. Pallotta. 1982. Properties of single calcium-activated potassium channels in cultured rat muscle. J. Physiol. 331:211–230. - PMC - PubMed
    1. Bian, S., I. Favre, and E. Moczydlowski. 2001. Ca2+-binding activity of a COOH-terminal fragment of the Drosophila BK channel involved in Ca2+-dependent activation. Proc. Natl. Acad. Sci. USA. 98:4776–4781. - PMC - PubMed
    1. Braun, A., and L. Sy. 2001. Contribution of potential EF hand motifs to the calcium-dependent gating of a mouse brain large conductance, calcium-sensitive K+ channel. J. Physiol. 533:681–695. - PMC - PubMed

Publication types

MeSH terms

Substances