. 2005 Mar 7;201(5):817-28.
doi: 10.1084/jem.20041854. Epub 2005 Feb 28.

An immunoglobulin C kappa-reactive single chain antibody fusion protein induces tolerance through receptor editing in a normal polyclonal immune system

Affiliations

An immunoglobulin C kappa-reactive single chain antibody fusion protein induces tolerance through receptor editing in a normal polyclonal immune system

Djemel Ait-Azzouzene et al. J Exp Med. .

Abstract

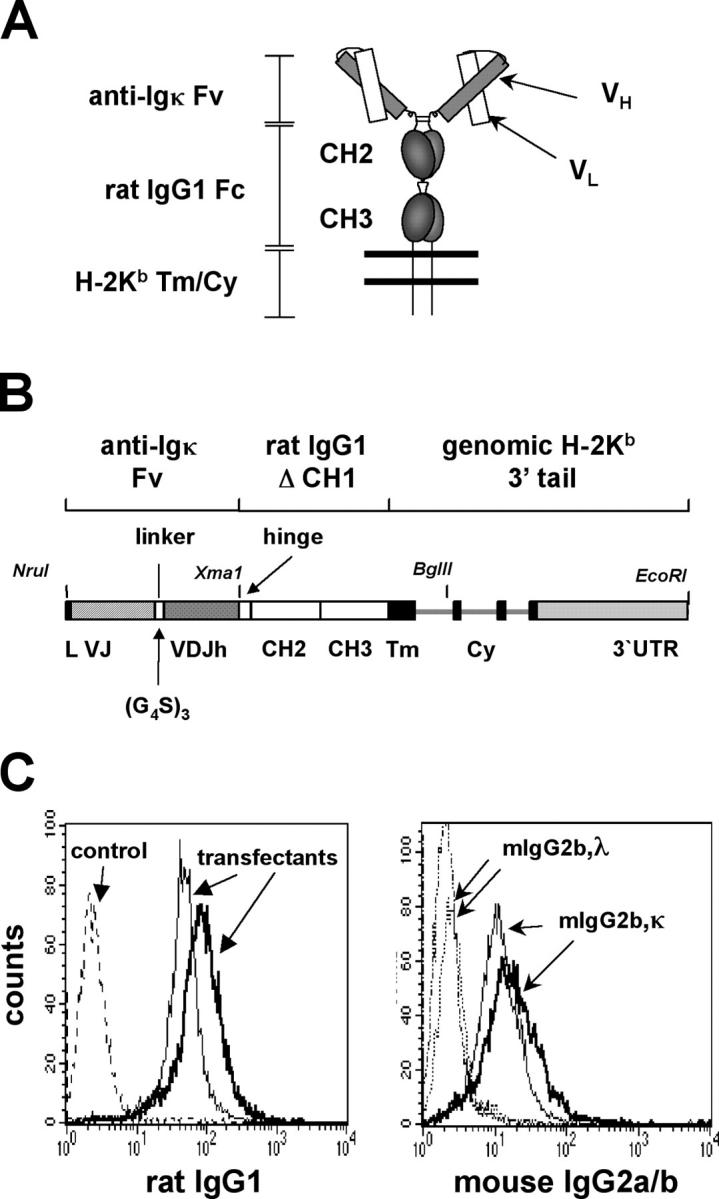
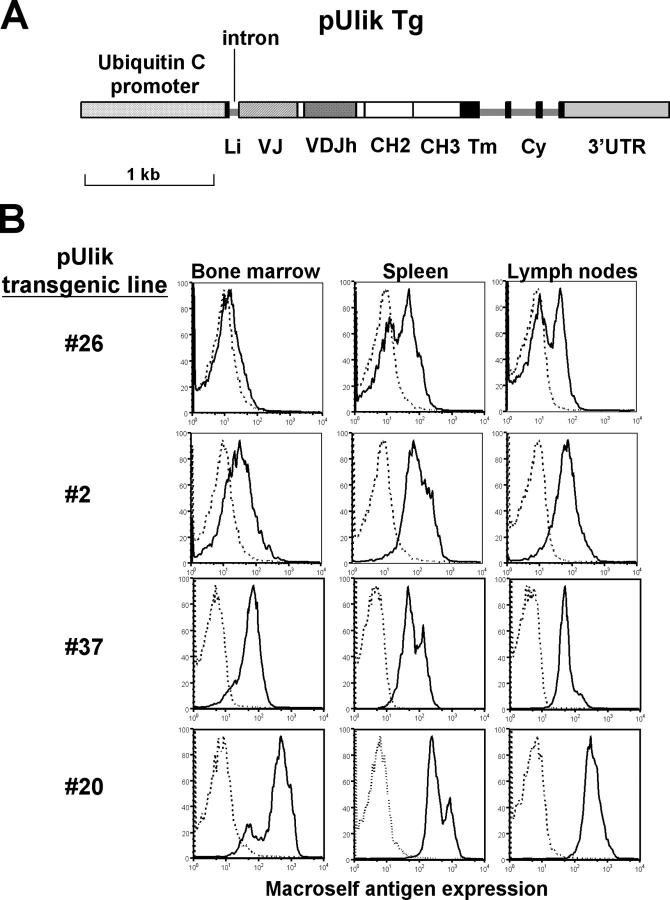
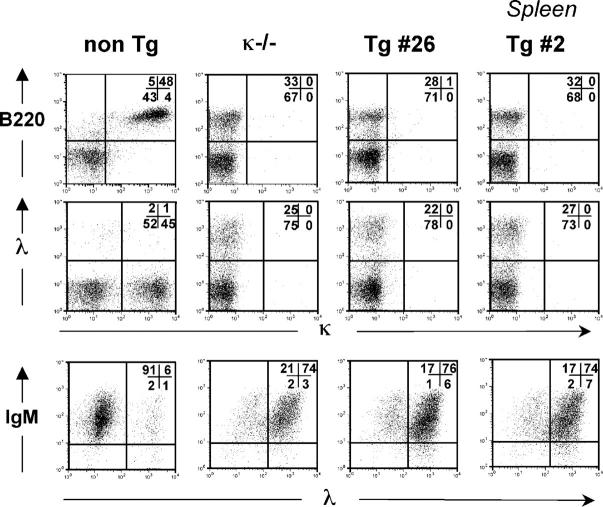
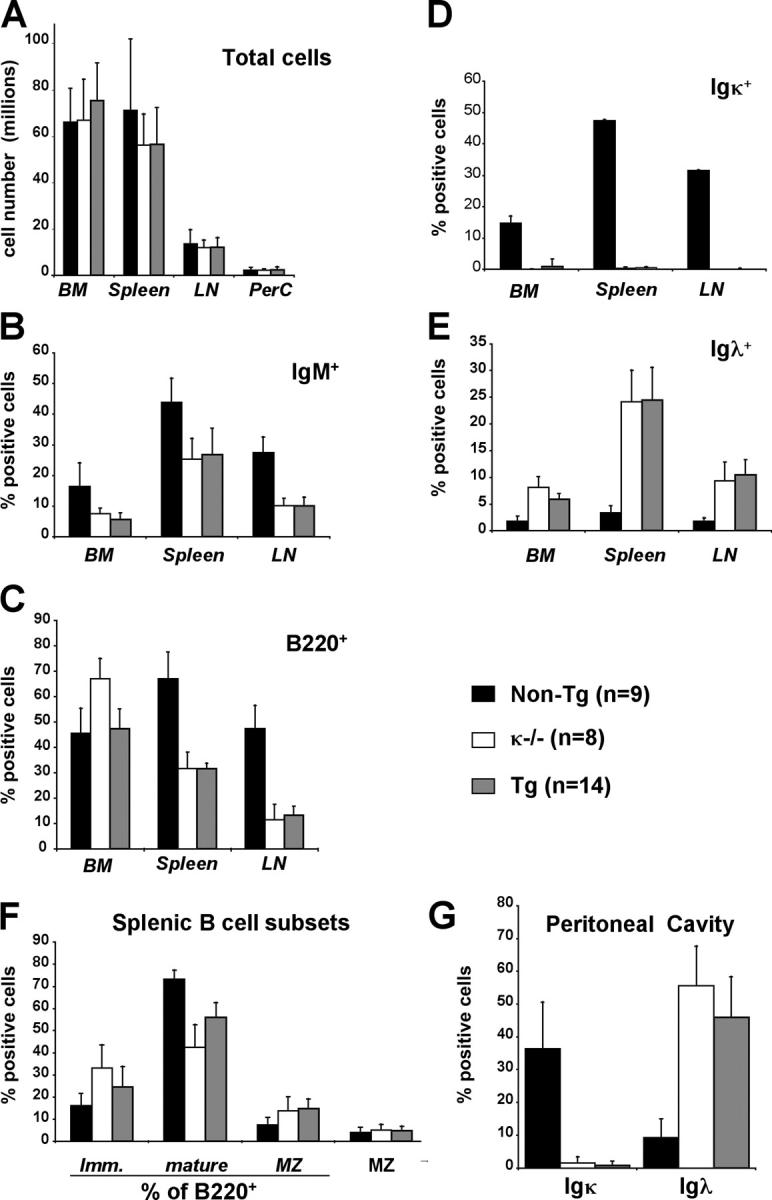
Understanding immune tolerance mechanisms is a major goal of immunology research, but mechanistic studies have generally required the use of mouse models carrying untargeted or targeted antigen receptor transgenes, which distort lymphocyte development and therefore preclude analysis of a truly normal immune system. Here we demonstrate an advance in in vivo analysis of immune tolerance that overcomes these shortcomings. We show that custom superantigens generated by single chain antibody technology permit the study of tolerance in a normal, polyclonal immune system. In the present study we generated a membrane-tethered anti-Igkappa-reactive single chain antibody chimeric gene and expressed it as a transgene in mice. B cell tolerance was directly characterized in the transgenic mice and in radiation bone marrow chimeras in which ligand-bearing mice served as recipients of nontransgenic cells. We find that the ubiquitously expressed, Igkappa-reactive ligand induces efficient B cell tolerance primarily or exclusively by receptor editing. We also demonstrate the unique advantages of our model in the genetic and cellular analysis of immune tolerance.


Figures

Figure 1.
Figure 1.
Design and in vitro testing of a synthetic B cell superantigen. (A) Schematic representation of the predicted protein structure of membrane bound anti–mouse Igκ-macroself Ag. A single chain Fv generated from the anti-κ hybridoma 187 is linked to the hinge and membrane proximal domains of rat IgG1 followed by transmembrane and cytoplasmic tail regions (Tm/Cy) of H-2Kb. (B) Gene construct encoding κ-macroself antigen showing intron/exon structure and selected features. Introns are depicted as thin lines. (G4S)3 refers to linker codons in one letter amino acid code: GGGGSGGGGSGGGGS. For stable transfection analysis, the gene shown was inserted into an expression vector providing a human cytomegalovirus promoter and zeocin resistance gene, generating plasmid pmSCA187ΔCH1. (C) Flow cytometry analysis of stably transfected cell lines. Two clones were analyzed for surface expression of the macroself Ag. (Left) Staining with an anti–rat IgG1 monoclonal antibody compared with empty vector-transfected control. (Right) Testing of binding specificity of the macroself antigen to mouse Ig light chain isotype. Two transfectant cell lines were incubated with soluble mouse IgG2b,κ or IgG2b,λ and binding revealed with a secondary rat anti–mouse IgG2a/b reagent.
Figure 2.
Figure 2.
Generation of κ-macroself antigen transgenics and in vivo transgene expression. (A) Schematic representation of DNA construct used for microinjection to generate transgenic mice. Elements shown are approximately to scale. The pUliκ construct is a derivative of the gene shown in Fig. 1 B. It contains the κ-macroself Ag under the control of the human ubiquitin C promoter. The construct contains a Ig light chain gene leader exon and first intron. (B) Flow cytometry analysis of κ-macroself antigen expression in bone marrow, spleen, and lymph nodes of pUliκ transgenic mice as detected using an anti–rat IgG1Fc antibody (dotted lines, nontransgenic cells; solid line, pUliκ transgenic cells). Results from four different pUliκ transgenic lines are shown.
Figure 3.
Figure 3.
Flow cytometry analysis of κ-macroself transgenic lymphoid tissues showing reduction in frequency of κ1 B cells and increases in λ1 B cells. Cells from the indicated organs of 8-wk-old normal littermate, κ2/−, and transgenic lines #2 and #26 were analyzed. Lymphocytes were gated on forward scatter versus side scatter to eliminate myeloid cells, dead cells, and cell debris from the analysis (lymphocyte gate). The results shown are representative of at least four experiments. (Top) Analysis of expression of B220 and Igκ. Middle row of panels, costaining for Igλ1−3 and Igκ. (Bottom) B220+ gated cells were analyzed for expression of IgM and Igλ1−3. The percentage in each quadrant, rounded to the nearest 1% is indicated in the upper right corner of each plot.
Figure 4.
Figure 4.
Elimination of Igκ B cell and increase of Igλ cell number in κ-macroself transgenic mice. (A–G) Histograms show mean of total cell numbers (A) and the percentages (±SEM) of (B) IgM+, (C) B220+, (D) Igκ and (E) Igλ in bone marrow, spleen, and lymph nodes of the indicated mouse genetic types. All data except A and G involved use of a lymphocyte gate. (F) Mean percentages of immature, mature, and marginal zone splenic B cells. (G) Shown are mean percentages of Igλ+ and Igκ+ B lymphocytes in the peritoneal cavity, gated on large, CD5+ lymphocytes to focus on the B-1 subset. These cells were B220intermediate, IgMhigh, and IgDlow. In the inset the number of experimental animals analyzed per group is noted in parentheses next to the symbol of mouse type.
Figure 5.
Figure 5.
Increased output of Igλ1 cells in κ-macroself antigen mice. (A) Bone marrow cells from κ2/−, κ-macroself transgenic, or nontransgenic littermate mice were stained with B220 and Igλ1−3 and analyzed by flow cytometry. The B220intermediate1 population is found in the lower box. Data shown was analyzed using a lymphocyte gate. (B) Summary of quantitation of newly formed λ1 cells as illustrated in A. Newly formed λ1 cell numbers (obtained from the bone marrow of two legs) were 0.3 (±0.1), 0.7 (±0.2), and 1 (±0.3) million cells in the nontransgenic littermate, the κ2/− and the κ-macroself transgenic mice, respectively.
Figure 6.
Figure 6.
Evaluation of molecular parameters of receptor editing in κ-macroself transgenic, littermate control, and κ2/− mice. (A, top rows) PCR detection of Vλ1–Jλ1 rearrangement excision products in genomic DNA extracted from anti-B220 magnetic bead purified B cells of bone marrow and spleen. Fourfold DNA serial template dilutions were tested. Tail DNA was used as a negative control (lane 17). PCR products were quantitated by Southern blot using specific probes. (Middle rows) Detection of RS-to-IRS1 and RS-to-IRS2 joins. (Bottom rows) PCR product located 3′ to the 3′-RS Igκ sequence is used as a DNA loading control (control). (B) Quantitation of RAG1 and RAG2 mRNA levels in B220+ bone marrow cells by quantitative Northern blot. (C) Quantitation of Ig Vλ1-to-Jλ1 excision product rearrangements detected by PCR in DNA of B220+ cells isolated from bone marrow or spleens of the indicated mouse types.
Figure 7.
Figure 7.
Intracellular immunofluorescence analysis of BrdU uptake and immunoglobulin expression in κ-macroself transgenic mice and littermates. (A) BrdU uptake with time of labeling in bone marrow B220intermediate cells of transgenic mice (open circles) or littermates (diamonds). (Left) BrdU incorporation in total B220intermediate cells; (right) BrdU incorporation in sIgM+/B220intermediate cells. (B) Comparison of surface Igκ staining (top), with intracellular Igκ staining (bottom). (C) Costaining for intracellular Igκ and either sIgM alone (left) or both surface and cytoplasmic IgM (right). (D) Statistical analysis of experiments shown in b and c. Left pair of bars shows the percentages of cells found in lower analysis boxes of B220/intracellular Igκ stain (i.e., B, bottom). The right pair of bars shows percentages of cells in upper two quadrants of intracellular IgM/intracellular Igκ stain with B220low gate (C, right). Means and standard deviations are indicated. Filled bars, transgenic; open bars, nontransgenic littermates.
Figure 8.
Figure 8.
Flow cytometry analysis of tolerance induction in radiation chimeras using κ-macroself transgenic hosts. Mice were analyzed at 6 wk post reconstitution. (A and B) Analysis of bone marrow lymphocytes using anti-L chain and B220 antibodies. Bone marrow donors are indicated to the left of the arrows, the recipient mouse genotypes are shown just below. Newly formed lymphocytes carrying Ig-κ or -λ, were identified as falling in the lower analysis boxes, as indicated. (A) B6 (wt) or RAG+/− bone marrow was used to reconstitute lethally irradiated CD45.1+/κ-macroself transgenic #2 (Tg #2) or littermate recipients. (B) Comparison of chimeras generated with bone marrow from Bcl-2 transgenic or littermate (wt) donors, using as irradiated recipients either transgenic #2 or littermate. (C) Analysis of spleen cells from the indicated radiation chimeras. Recipient mouse genotype is shown to the right of arrows above dot plots. Cells were stained with B220 and anti-κ antibodies (top) or anti-κ and anti-λ antibodies (bottom).

References

    1. Klinman, N.R. 1996. The “clonal selection hypothesis” and current concepts of B cell tolerance. Immunity. 5:189–195. - PubMed
    1. Nossal, G.J. 1983. Cellular mechanisms of immunologic tolerance. Annu. Rev. Immunol. 1:33–62. - PubMed
    1. Storb, U. 1987. Transgenic mice with immunoglobulin genes. Annu. Rev. Immunol. 5:151–174. - PubMed
    1. Goodnow, C.C. 1992. Transgenic mice and analysis of B-cell tolerance. Annu. Rev. Immunol. 10:489–518. - PubMed
    1. Miller, J.F., and A. Basten. 1996. Mechanisms of tolerance to self. Curr. Opin. Immunol. 8:815–821. - PubMed

Publication types

MeSH terms

Substances