. 2005 Mar 7;201(5):703-11.
doi: 10.1084/jem.20042251. Epub 2005 Feb 28.

Defective B cell tolerance checkpoints in systemic lupus erythematosus

Affiliations

Defective B cell tolerance checkpoints in systemic lupus erythematosus

Sergey Yurasov et al. J Exp Med. .

Abstract

A cardinal feature of systemic lupus erythematosus (SLE) is the development of autoantibodies. The first autoantibodies described in patients with SLE were those specific for nuclei and DNA, but subsequent work has shown that individuals with this disease produce a panoply of different autoantibodies. Thus, one of the constant features of SLE is a profound breakdown in tolerance in the antibody system. The appearance of self-reactive antibodies in SLE precedes clinical disease, but where in the B cell pathway tolerance is first broken has not been defined. In healthy humans, autoantibodies are removed from the B cell repertoire in two discrete early checkpoints in B cell development. We found these checkpoints to be defective in three adolescent patients with SLE. 25-50% of the mature naive B cells in SLE patients produce self-reactive antibodies even before they participate in immune responses as compared with 5-20% in controls. We conclude that SLE is associated with abnormal early B cell tolerance.


Figures
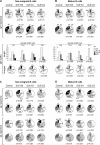
Figure 1.
Figure 1.
IgH and IgL chain sequence features. IgH V and J gene repertoire, CDR3 length, and number of positively charged residues from new emigrant (A) and mature naive (B) B cells. Pie charts depict VH and JH family usage (top) and the proportion of IgH CDR3s with 0, 1, 2, or ≥3 positive charges (bottom). Bar graphs show frequencies of IgH CDR3s with 9 aa (white bars), 10–14 aa (light gray bars), 15–19 aa (dark gray bars), and ≥20 aa (black bars). The absolute number of sequences analyzed in each B cell compartment is indicated in the center of the pie charts. V and J family gene usage for Igκ and Igλ light chains from new emigrant (C) and mature naive (D) B cells. Values for controls in this and other figures were published previously and are shown here for comparison (13). p-values indicated below the charts are in comparison with control (reference 13).
Figure 2.
Figure 2.
HEp-2 ELISA and immunofluorescence. HEp-2 ANA ELISA results for antibodies cloned from new emigrant (A) and (B) mature naive B cells from SLE patients. Dotted lines show ED38 positive control (references 13, 44). Horizontal line shows cut-off OD405 for positive reactivity. Staining patterns of antibodies found in new emigrant (C) and mature (D) antibodies by IFA (Fig. S2). For each patient, the frequency of HEp-2 reactive and nonreactive clones as measured by HEp-2 ANA ELISA (A and B) or IFA (C and D) is summarized in pie charts with the number of antibodies tested indicated in the centers. All p-values are in comparison to previously published controls from the same B cell compartment (reference 13).
Figure 3.
Figure 3.
Polyreactivity ELISAs. Antibodies from (A) new emigrant and (B) mature naive B cells were tested by ELISA for reactivity with ssDNA, dsDNA, insulin, and LPS. Dotted lines show ED38 positive control (references 13, 44). Horizontal line shows cut-off OD405 for positive reactivity. The frequency of reactive clones in percent and the absolute number of reactive antibodies out of all tested antibodies are indicated below the graphs. p-values are in comparison to previously published controls from the same B cell compartment (reference 13).
Figure 4.
Figure 4.
PS ELISA. Antibodies from (A) new emigrant and (B) mature naive B cells were tested by ELISA for reactivity with phosphatidylserine (PS). Dotted lines show ED38 positive control (references 13, 44). Horizontal line shows cut-off OD405 for positive reactivity as determined by comparison to the negative control antibody mGO53 (green line) and low positive control antibody eiJB40 (red line) that were included in the assay. The frequency of reactive clones in percent and the absolute number of reactive antibodies out of all tested antibodies are indicated below the graphs.

Comment in

References

    1. Theofilopoulos, A.N., and F.J. Dixon. 1985. Murine models of systemic lupus erythematosus. Adv. Immunol. 37:269–390. - PubMed
    1. Kotzin, B.L. 1996. Systemic lupus erythematosus. Cell. 85:303–306. - PubMed
    1. Davidson, A., and B. Diamond. 2001. Autoimmune diseases. N. Engl. J. Med. 345:340–350. - PubMed
    1. Wakeland, E.K., K. Liu, R.R. Graham, and T.W. Behrens. 2001. Delineating the genetic basis of systemic lupus erythematosus. Immunity. 15:397–408. - PubMed
    1. Miller, G.W., and V. Nussenzweig. 1975. A new complement function: solubilization of antigen-antibody aggregates. Proc. Natl. Acad. Sci. USA. 72:418–422. - PMC - PubMed

Publication types