

Long-range cooperative binding of kinesin to a microtubule in the presence of ATP
- PMID: 15738263
- PMCID: PMC2171822
- DOI: 10.1083/jcb.200409035
Long-range cooperative binding of kinesin to a microtubule in the presence of ATP
Abstract
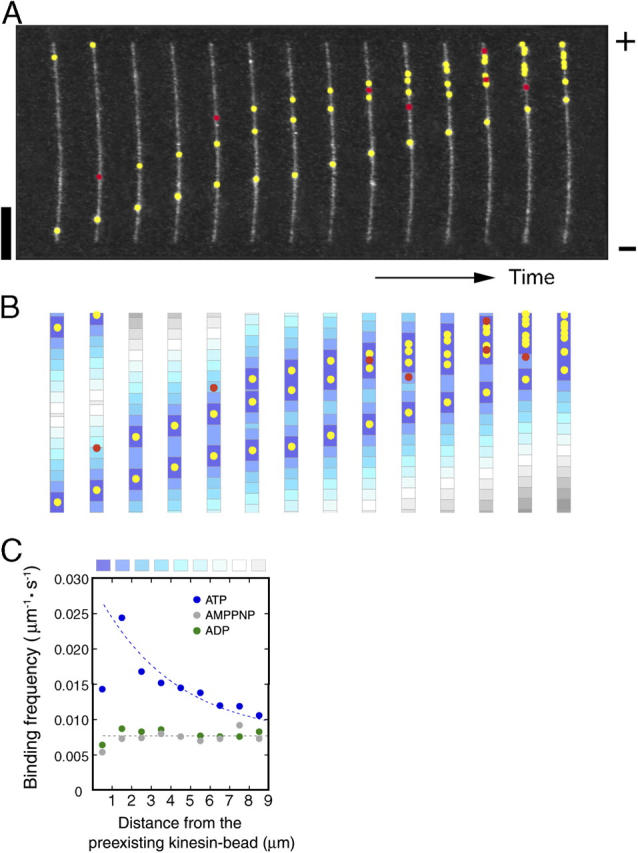
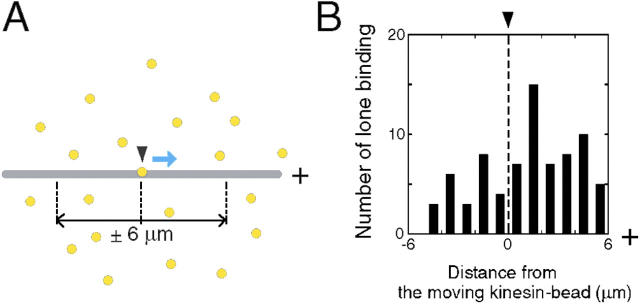
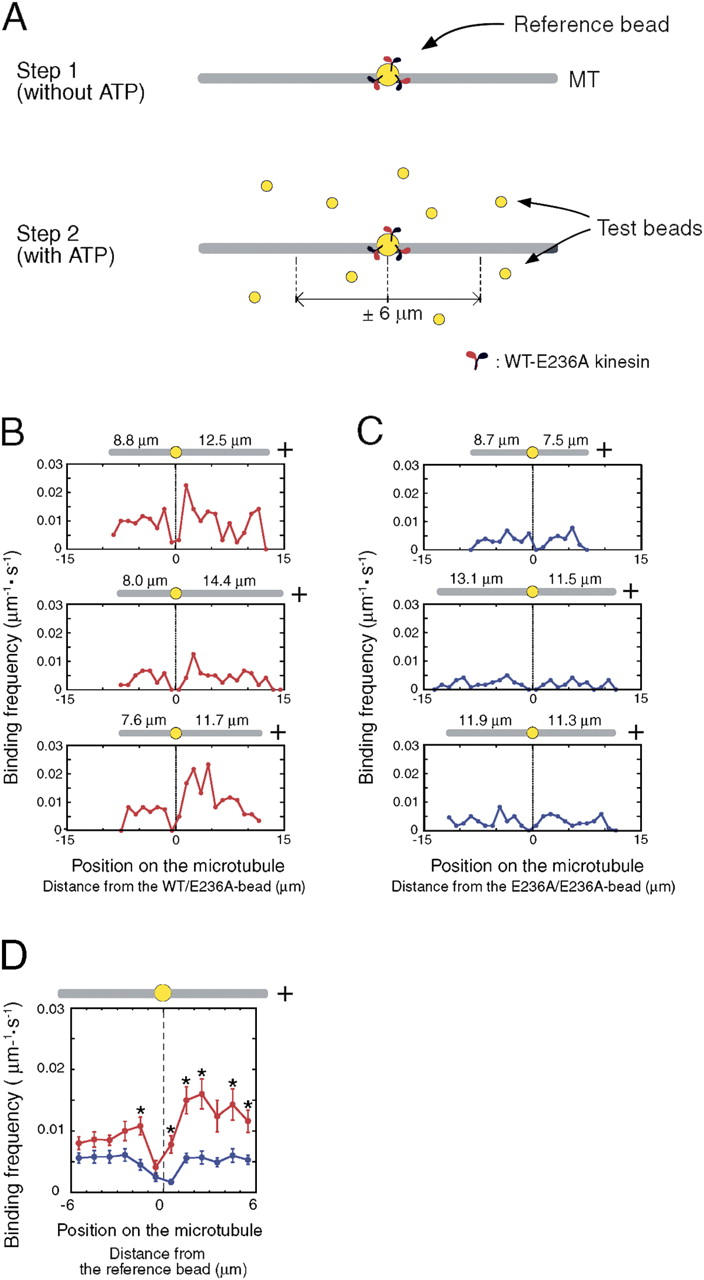
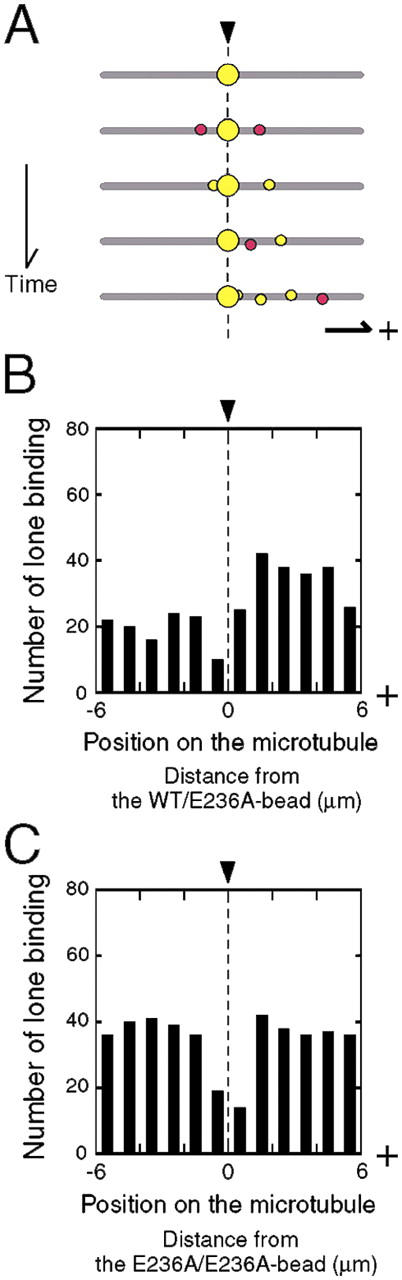
Interaction of kinesin-coated latex beads with a single microtubule (MT) was directly observed by fluorescence microscopy. In the presence of ATP, binding of a kinesin bead to the MT facilitated the subsequent binding of other kinesin beads to an adjacent region on the MT that extended for micrometers in length. This cooperative binding was not observed in the presence of ADP or 5'-adenylylimidodiphosphate (AMP-PNP), where binding along the MT was random. Cooperative binding also was induced by an engineered, heterodimeric kinesin, WT/E236A, that could hydrolyze ATP, yet remained fixed on the MT in the presence of ATP. Relative to the stationary WT/E236A kinesin on a MT, wild-type kinesin bound preferentially in close proximity, but was biased to the plus-end direction. These results suggest that kinesin binding and ATP hydrolysis may cause a long-range state transition in the MT, increasing its affinity for kinesin toward its plus end. Thus, our study highlights the active involvement of MTs in kinesin motility.
Figures
Similar articles
-
Release of isolated single kinesin molecules from microtubules.Biochemistry. 1998 Jan 13;37(2):747-57. doi: 10.1021/bi971534o. Biochemistry. 1998. PMID: 9425099
-
Pathway of ATP hydrolysis by monomeric and dimeric kinesin.Biochemistry. 1998 Jan 20;37(3):800-13. doi: 10.1021/bi9711184. Biochemistry. 1998. PMID: 9454569
-
Weak and strong states of kinesin and ncd.J Mol Biol. 1996 Mar 22;257(1):66-76. doi: 10.1006/jmbi.1996.0147. J Mol Biol. 1996. PMID: 8632460
-
Molecular motors: the natural economy of kinesin.Curr Biol. 1997 Oct 1;7(10):R631-3. doi: 10.1016/s0960-9822(06)00320-4. Curr Biol. 1997. PMID: 9368744 Review.
-
Single molecule imaging and nanomanipulation of biomolecules.Methods Cell Biol. 1998;55:117-28. doi: 10.1016/s0091-679x(08)60405-7. Methods Cell Biol. 1998. PMID: 9352514 Review. No abstract available.
Cited by
-
Mechanical Model of Nuclei Ordering in Drosophila Embryos Reveals Dilution of Stochastic Forces.Biophys J. 2018 Apr 10;114(7):1730-1740. doi: 10.1016/j.bpj.2018.02.018. Biophys J. 2018. PMID: 29642041 Free PMC article.
-
Studying molecular motor-based cargo transport: what is real and what is noise?Biophys J. 2007 Apr 15;92(8):2953-63. doi: 10.1529/biophysj.106.097253. Epub 2007 Feb 2. Biophys J. 2007. PMID: 17277186 Free PMC article.
-
Micron-scale geometrical features of microtubules as regulators of microtubule organization.Elife. 2021 Jun 11;10:e63880. doi: 10.7554/eLife.63880. Elife. 2021. PMID: 34114950 Free PMC article. Review.
-
Structural model of microtubule dynamics inhibition by kinesin-4 from the crystal structure of KLP-12 -tubulin complex.Elife. 2022 Sep 6;11:e77877. doi: 10.7554/eLife.77877. Elife. 2022. PMID: 36065637 Free PMC article.
-
Alphaherpesviruses and the cytoskeleton in neuronal infections.Viruses. 2011 Jul;3(7):941-81. doi: 10.3390/v3070941. Epub 2011 Jun 27. Viruses. 2011. PMID: 21994765 Free PMC article. Review.
References
-
- Block, S.M., L.S. Goldstein, and B.J. Schnapp. 1990. Bead movement by single kinesin molecules studied with optical tweezers. Nature. 348:348–352. - PubMed
-
- Crevel, I.M., A. Lockhart, and R.A. Cross. 1996. Weak and strong states of kinesin and ncd. J. Mol. Biol. 257:66–76. - PubMed
-
- Hoenger, A., and R.A. Milligan. 1997. Motor domains of kinesin and ncd interact with microtubule protofilaments with the same binding geometry. J. Mol. Biol. 265:553–564. - PubMed
MeSH terms
Substances
LinkOut - more resources
Full Text Sources
Other Literature Sources
Miscellaneous
