. 2005 Mar 15;102(11):3942-7.
doi: 10.1073/pnas.0500812102. Epub 2005 Feb 28.

Independence of replisomes in Escherichia coli chromosomal replication

Affiliations

Independence of replisomes in Escherichia coli chromosomal replication

Adam M Breier et al. Proc Natl Acad Sci U S A. .

Abstract

In Escherichia coli DNA replication is carried out by the coordinated action of the proteins within a replisome. After replication initiation, the two bidirectionally oriented replisomes from a single origin are colocalized into higher-order structures termed replication factories. The factory model postulated that the two replisomes are also functionally coupled. We tested this hypothesis by using DNA combing and whole-genome microarrays. Nascent DNA surrounding oriC in single, combed chromosomes showed instead that one replisome, usually the leftward one, was significantly ahead of the other 70% of the time. We next used microarrays to follow replication throughout the genome by measuring DNA copy number. We found in multiple E. coli strains that the replisomes are independent, with the leftward replisome ahead of the rightward one. The size of the bias was strain-specific, varying from 50 to 130 kb in the array results. When we artificially blocked one replisome, the other continued unabated, again demonstrating independence. We suggest an improved version of the factory model that retains the advantages of threading DNA through colocalized replisomes at about equal rates, but allows the cell flexibility to overcome obstacles encountered during elongation.


Figures
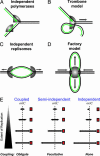
Fig. 1.
Fig. 1.
Higher-order organization of DNA replication. (A) Independent polymerases at a replication fork. DNA strands (parental in black, daughters in green) are antiparallel, so the polymerases (gray) move in opposite directions during replication. (B) The trombone model. The two polymerases at a fork are colocalized, forming a replisome. The lagging-strand template is looped so that both polymerases face in the same direction. (C) The train-on-tracks model. The two replisomes are independent and move apart along the DNA template. (D) The factory model. The two replisomes are colocalized and relatively stationary, forming a factory that reels in parental DNA and extrudes looped nascent chromosomes. (E) A schematic of replisome behavior is shown for the three versions of the factory model. For simplicity, the looped organization of the factory model is omitted. Red squares indicate blocks to replication. In the coupled model as originally proposed, each replisome is always the same distance from oriC, and blocking one causes the other to stall. In the semiindependent model, the forks normally progress at the same rate, but uncoupling occurs if one fork is blocked. In the independent model, the forks may initiate at different times and move at different rates, and blocking one fork does not affect the other.
Fig. 5.
Fig. 5.
Blocking one replisome does not inhibit the other. Strain AB2937, containing an ectopic ter site at the lacZ locus, 28 map minutes right of the replication origin (Inset), was synchronized and induced to express Tus protein. Samples were taken 20 (green), 40 (blue), and 70 (purple) min after initiation. Shown are abundance versus distance from oriC for the rightward, blocked and leftward, unblocked halves of the chromosome, respectively. oriC is at the left edge, and the natural terminus is at the right edge. Black vertical lines mark the position of the ectopic ter in A and the equivalent position in B. At 20 min, the rightward fork had reached the ectopic ter, but at 40 min, the fork had stalled there. A subpopulation that bypassed the ter was visible at 30–50 min as a slight slope. Meanwhile, the entire population of leftward forks proceeded normally, unaffected by the blocking of the rightward fork.
Fig. 2.
Fig. 2.
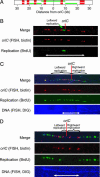
Single-molecule analysis of replication initiation. (A) Schematic diagram of expected oriC FISH and BrdUrd signals when labeling begins at (Upper) or after (Lower) initiation of replication. Four 2-kb FISH probes (red bars) are left of oriC (black dot), and one 2-kb probe and one 4-kb probe are to the right. In green is the expected BrdUrd signal for symmetric replication of 10 kb to each side. In Lower, the BrdUrd signal indicates that each replication fork was 10 kb from the origin when labeling began. (B) A combed DNA molecule showing unidirectional leftward initiation. The FISH signals (red) indicate the location and orientation of the origin. The signals, with an end-to-end distance of 16.4 μm (white arrow), have a length of 3.2 kb/μm. Replication, indicated by BrdUrd immunofluorescence (green), is visible only to the left of oriC. The replication signal is 2.3 μm or 7.3 kb long. DIG, digoxigenin. (C) A combed DNA molecule showing asymmetric, bidirectional replication. The 52-kb red FISH signal indicating oriC is 20.3 μm long. The green BrdUrd signal extends 65 kb (25.5 μm) to the left and 46 kb (18.0 μm) to the right. The genomic counterstain (blue; brightened at right for visibility) shows that the ends of the replication signal are not caused by DNA breaks. (D) A combed molecule in which replication initiated just before BrdUrd labeling. The 52-kb origin signal is 12.8 μm long (white arrow). We measured gaps of 11 kb (2.7 μm) to the left and 27 kb (6.7 μm) to the right, so the rightward fork is 16 kb ahead of its sister.
Fig. 3.
Fig. 3.
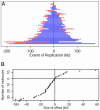
Summary of measurements of combed molecules. (A) Measurements from all combed molecules are shown, one molecule per line, in the order of total replication (left plus right). The length by which one replisome has outpaced the other is shown in red. Molecules in which this difference is statistically significant are indicated by *. (B) The offset (right minus left) measured in each combed molecule is plotted in the order of offset magnitude. Offsets between –14 and +2 kb are most common. Twenty-four molecules showed a leftward offset >6.8 kb, and eight molecules showed a rightward bias >6.8 kb.
Fig. 4.
Fig. 4.
Microarray analysis of DNA replication in synchronized cells. (A) Data from an early time point (turquoise) were normalized to the terminus and plotted by distance from oriC (horizontal) and relative abundance (vertical). Each point corresponds to a gene on the microarray. Smoothing of the data using lowess (blue and purple) revealed that loci near the origin had an average copy number near 2, indicating DNA replication. (B) A series of straight lines (red and orange) was fit to the data for each time point. The average replication fork position was assigned as the midpoint of the sloped line. (C) Thirteen samples were taken from a synchronized culture of WPC2. The results for each fork were plotted versus time. (D) Six samples were taken from a synchronized culture of MG1655dnaC2, and results were plotted as in C.
Fig. 6.
Fig. 6.
Examples of unidirectional late-stage replication. Parental DNA is black, and nascent DNA is green. (Left) The end of prokaryotic chromosomal replication is depicted. The fork coming from the right encounters a ter site and stalls. The fork from the left must complete replication by proceeding unidirectionally. (Right) Replication of a eukaryotic chromosome is shown. Unevenly spaced origins initiate bidirectionally, but closely spaced forks converge and terminate, and their divergent counterparts must complete replication unidirectionally.

Similar articles

Cited by

References

    1. Kornberg, A. & Baker, T. A. (1992) DNA Replication (Freeman, New York).
    1. Alberts, B. M., Barry, J., Bedinger, P., Formosa, T., Jongeneel, C. V. & Kreuzer, K. N. (1983) Cold Spring Harb. Symp. Quant. Biol. 47, 655–668. - PubMed
    1. Lee, J., Chastain, P. D., 2nd, Kusakabe, T., Griffith, J. D. & Richardson, C. C. (1998) Mol. Cell 1, 1001–1010. - PubMed
    1. Pages, V. & Fuchs, R. P. (2003) Science 300, 1300–1303. - PubMed
    1. Higuchi, K., Katayama, T., Iwai, S., Hidaka, M., Horiuchi, T. & Maki, H. (2003) Genes Cells 8, 437–449. - PubMed

Publication types

MeSH terms