. 2005 Mar 8;102(10):3840-5.
doi: 10.1073/pnas.0409777102. Epub 2005 Feb 28.

Automated microscope system for determining factors that predict neuronal fate

Affiliations

Automated microscope system for determining factors that predict neuronal fate

Montserrat Arrasate et al. Proc Natl Acad Sci U S A. .

Abstract

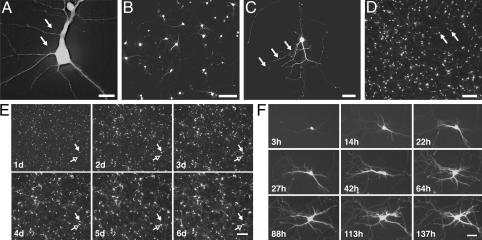
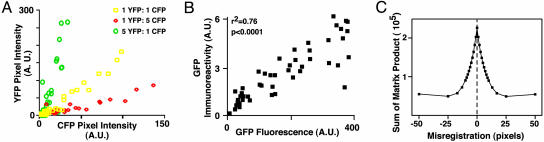
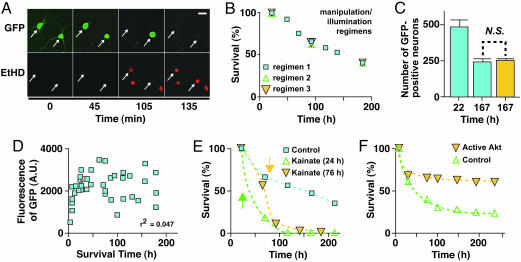
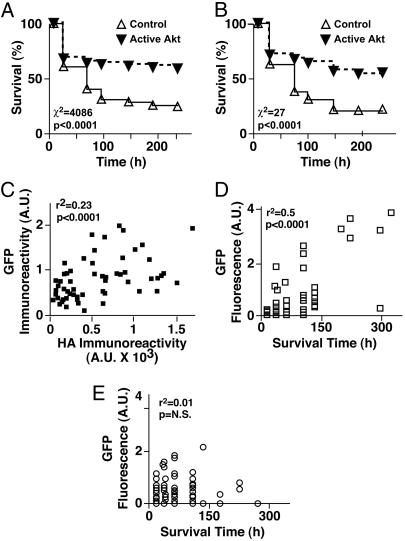
Unraveling cause-and-effect relationships in the nervous system is challenging because some biological processes begin stochastically, take a significant amount of time to unfold, and affect small neuronal subpopulations that can be difficult to isolate and measure. Single-cell approaches are slow, subject to user bias, and sometimes too laborious to achieve sample sizes large enough to detect important effects. Here, we describe an automated imaging and analysis system that enables us to follow the fates of individual cells and intracellular proteins over time. Observations can be quantified in a high-throughput manner with minimal user bias. We have adapted survival analysis methods to determine whether and how factors measured during longitudinal analysis predict a particular biological outcome. The ability to monitor complex processes at single-cell resolution quickly, quantitatively, and over long intervals should have wide applications for biology.


Figures

Fig. 1.
Fig. 1.
Highly resolved images of neurons grown on plastic tissue-culture dishes and expressing a variety of fluorescent proteins. (A) Spines (arrows) on dendrites of a cortical neuron transfected with dsRED. (×40, N.A. 0.60; scale bar, 15 μm.) (B) Cell bodies and neurites of a group of neurons containing CFP. (×10, N.A. 0.30; scale bar, 150 μm.) (C) Growth cones and neurites (arrows) on a striatal neuron expressing GFP. (×20, N.A. 0.45; scale bar, 50 μm.) (D) Cell bodies (arrows) of cortical neurons transfected with GFP. (×4, N.A. 0.13; scale bar, 300 μm.) (E) Images collected (×4) at approximately daily intervals after transfection demonstrate the ability to return to the same field of neurons. One neuron (open arrow) survives throughout the experiment; another (filled arrow) dies between days 4 and 5. (Scale bar, 300 μm.) (F) Intracellular and extracellular structures (e.g., neurites) of single neurons can be resolved and monitored over time. (×20, N.A. 0.45; scale bar, 60 μm.)
Fig. 2.
Fig. 2.
Boolean image analysis. (A) Neurons were cotransfected with CFP, YFP, or both. Cell-by-cell comparison of CFP and YFP fluorescence from neurons transfected with CFP and YFP in various ratios reveals that nearly all neurons are cotransfected and that the fluorescence intensities of the two transfected proteins are highly correlated (r2 = 0.99). (B) Cell-by-cell comparison of GFP expression as estimated by measuring GFP fluorescence directly and by measuring immunofluorescence against GFP. (C) A matrix algorithm to register two images. Here, two images are placed out of register in the xy plane to various degrees and then subjected to a computer algorithm that calculates the sum of a product matrix derived from the two images. The sum is maximal when the two images are registered. A.U., arbitrary units.
Fig. 3.
Fig. 3.
Automated imaging of neuronal survival. (A) GFP-transfected neurons (arrows) were treated with kainate in the presence of the membrane-impermeant nuclear dye EtHD. Loss of GFP fluorescence correlated with loss of membrane integrity and nuclear staining with EtHD (n = 12). (Scale bar, 50 μm.) (B) The frequency of automated imaging measurements did not detectably affect survival. Neurons in sister cultures subjected to (1) daily removal from the incubator and imaging, (2) daily removal from the incubator with imaging every third day, or (3) removal from the incubator and imaging every third day survived equally well. (C) In parallel, one culture of transfected neurons was imaged once at the end of the experiment (gold bar), and the other was imaged both 1 day after transfection and at the end of the experiment (blue bars). The survival rates were nearly identical. N.S., not significant. (D) GFP expression does not detectably affect survival. The duration of survival of each neuron was determined and plotted against the GFP expression level in that neuron before its death. GFP expression did not correlate with neuronal survival by correlation analysis (n = 2). A.U., arbitrary units. (E) Automated imaging and analysis demonstrate kainate neurotoxicity (n = 2). The survival of transfected neurons in three sister cultures was compared. In the first (blue squares), neurons were left untreated. In the second (gold triangles) and third (green triangles), kainate (10 μM) was added 24 or 76 h after transfection, respectively. Neuronal survival significantly decreased soon after kainate treatment in both treated cultures. (F) Automated imaging and analysis detects the ability of CA-Akt to promote neuronal survival (n = 3). Neurons were transfected with GFP and either an expression plasmid for CA-Akt (gold triangles) or an empty control vector (green triangles).
Fig. 4.
Fig. 4.
Applications of survival analysis. (A) Kaplan–Meier analysis of population-based Akt survival data. The number of surviving neurons transfected with CA-Akt or an empty vector was determined at different intervals from a longitudinal series of low-magnification (×4) images. The number of neurons that died during each interval was deduced by comparing identical microscope fields before and after the interval. By convention, the neurons that died during a particular interval were assigned an event (i.e., survival) time that corresponded to the end of that interval. These event times were used to construct the Kaplan–Meier cumulative survival plot shown and analyzed for statistical significance by the log-rank (Mantel–Cox) test (n = 2). (B) Kaplan-Meier analysis of single-cell-based Akt survival data. Three higher-magnification (×20) images of the same transfected neurons as in A were collected longitudinally. Individual neurons were identified in each of the three images. The approach described in A was used to determine the event time for each neuron by comparing images of those neurons collected at different time points, and a Kaplan-Meier survival plot was constructed (n = 2). (C) Neurons cotransfected with GFP and with hemagglutinin-tagged CA-Akt were immunostained, and fluorescent signals were measured and correlated cell by cell. Expression of GFP and CA-Akt are significantly correlated, suggesting that GFP fluorescence in vivo can be used as a surrogate for CA-Akt expression. (D and E) GFP fluorescence is correlated with and predicts longevity in neurons cotransfected with CA-Akt (D) but not in those cotransfected with empty vector (E). A.U., arbitrary units; N.S., not significant.

References

    1. Pituello, F. (1997) Curr. Biol. 7, R701-R704. - PubMed
    1. Brody, T. & Odenwald, W. F. (2002) Development (Cambridge, U.K.) 129, 3763-3770. - PubMed
    1. McConnell, S. K. (1995) J. Neurosci. 15, 6987-6998. - PMC - PubMed
    1. Price, J., Williams, B. P. & Götz, M. (1995) Ciba Found. Symp. 193, 71-84. - PubMed
    1. Clarke, G., Collins, R. A., Leavitt, B. R., Andrews, D. F., Hayden, M. R., Lumsden, C. J. & McInnes, R. R. (2000) Nature 406, 195-199. - PubMed

Publication types

LinkOut - more resources