

Ultrasensitivity and noise propagation in a synthetic transcriptional cascade
- PMID: 15738412
- PMCID: PMC552778
- DOI: 10.1073/pnas.0408507102
Ultrasensitivity and noise propagation in a synthetic transcriptional cascade
Abstract
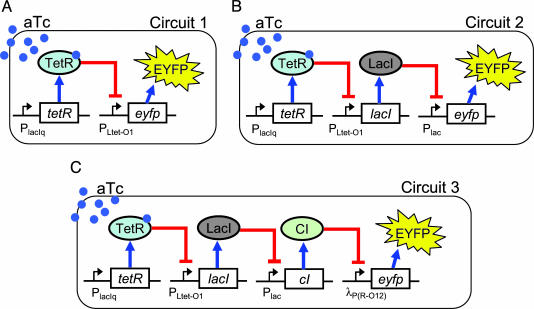
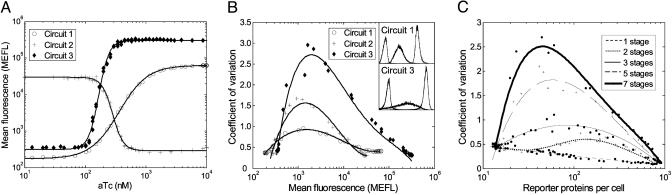
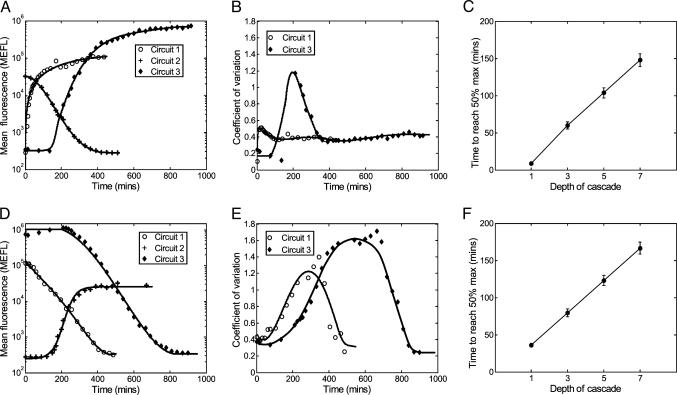
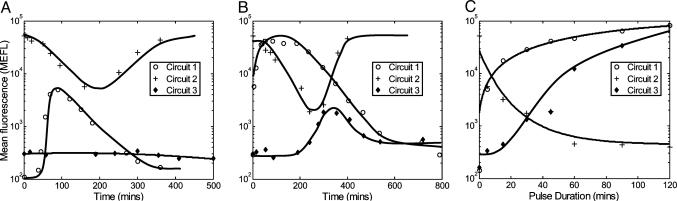
The precise nature of information flow through a biological network, which is governed by factors such as response sensitivities and noise propagation, greatly affects the operation of biological systems. Quantitative analysis of these properties is often difficult in naturally occurring systems but can be greatly facilitated by studying simple synthetic networks. Here, we report the construction of synthetic transcriptional cascades comprising one, two, and three repression stages. These model systems enable us to analyze sensitivity and noise propagation as a function of network complexity. We demonstrate experimentally steady-state switching behavior that becomes sharper with longer cascades. The regulatory mechanisms that confer this ultrasensitive response both attenuate and amplify phenotypical variations depending on the system's input conditions. Although noise attenuation allows the cascade to act as a low-pass filter by rejecting short-lived perturbations in input conditions, noise amplification results in loss of synchrony among a cell population. The experimental results demonstrating the above network properties correlate well with simulations of a simple mathematical model of the system.
Figures
Similar articles
-
Noise propagation in gene networks.Science. 2005 Mar 25;307(5717):1965-9. doi: 10.1126/science.1109090. Science. 2005. PMID: 15790857
-
Stochastic gene expression in a single cell.Science. 2002 Aug 16;297(5584):1183-6. doi: 10.1126/science.1070919. Science. 2002. PMID: 12183631
-
The effect of negative feedback on noise propagation in transcriptional gene networks.Chaos. 2006 Jun;16(2):026108. doi: 10.1063/1.2208927. Chaos. 2006. PMID: 16822040
-
Mammalian synthetic biology: engineering of sophisticated gene networks.J Biotechnol. 2007 Jul 15;130(4):329-45. doi: 10.1016/j.jbiotec.2007.05.014. Epub 2007 May 24. J Biotechnol. 2007. PMID: 17602777 Review.
-
Transcriptional noise and cellular heterogeneity in mammalian macrophages.Philos Trans R Soc Lond B Biol Sci. 2006 Mar 29;361(1467):495-506. doi: 10.1098/rstb.2005.1808. Philos Trans R Soc Lond B Biol Sci. 2006. PMID: 16524838 Free PMC article. Review.
Cited by
-
Dose response relationship in anti-stress gene regulatory networks.PLoS Comput Biol. 2007 Mar 2;3(3):e24. doi: 10.1371/journal.pcbi.0030024. Epub 2006 Dec 22. PLoS Comput Biol. 2007. PMID: 17335342 Free PMC article.
-
Construction of an in vitro bistable circuit from synthetic transcriptional switches.Mol Syst Biol. 2006;2:68. doi: 10.1038/msb4100099. Epub 2006 Dec 12. Mol Syst Biol. 2006. PMID: 17170763 Free PMC article.
-
A load driver device for engineering modularity in biological networks.Nat Biotechnol. 2014 Dec;32(12):1268-75. doi: 10.1038/nbt.3044. Epub 2014 Nov 24. Nat Biotechnol. 2014. PMID: 25419739 Free PMC article.
-
Elements of biological oscillations in time and space.Nat Struct Mol Biol. 2016 Dec 6;23(12):1030-1034. doi: 10.1038/nsmb.3320. Nat Struct Mol Biol. 2016. PMID: 27922613
-
Nature, nurture, or chance: stochastic gene expression and its consequences.Cell. 2008 Oct 17;135(2):216-26. doi: 10.1016/j.cell.2008.09.050. Cell. 2008. PMID: 18957198 Free PMC article. Review.
References
-
- Rosenfeld, N. & Alon, U. (2003) J. Mol. Biol. 329, 645-654. - PubMed
-
- Lee, T. I., Rinaldi, N. J., Robert, F., Odom, D. T., Bar-Joseph, Z., Gerber, G. K., Hannett, N. M., Harbison, C. T., Thompson, C. M., Simon, I., et al. (2002) Science 298, 799-804. - PubMed
-
- Shen-Orr, S. S., Milo, R., Mangan, S. & Alon. U. (2002) Nat. Genet. 31, 64-68. - PubMed
Publication types
MeSH terms
Substances
LinkOut - more resources
Full Text Sources
Other Literature Sources
Research Materials
