

Theta oscillations and sensorimotor performance
- PMID: 15738424
- PMCID: PMC553293
- DOI: 10.1073/pnas.0407920102
Theta oscillations and sensorimotor performance
Abstract
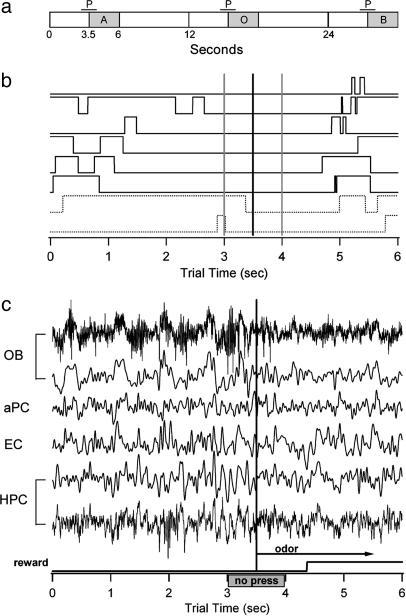
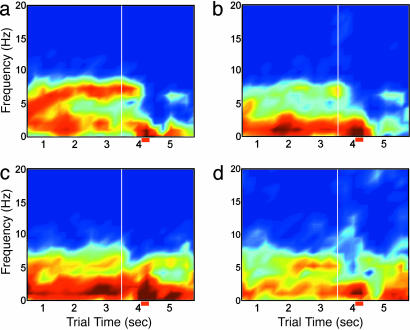
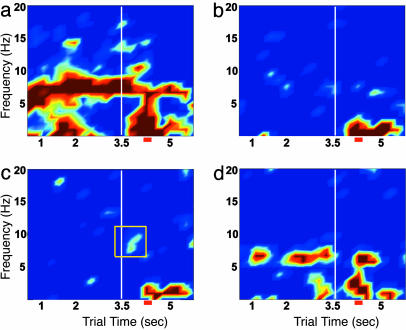
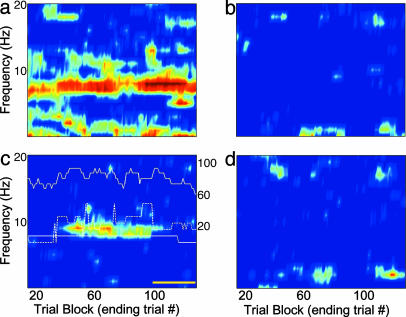
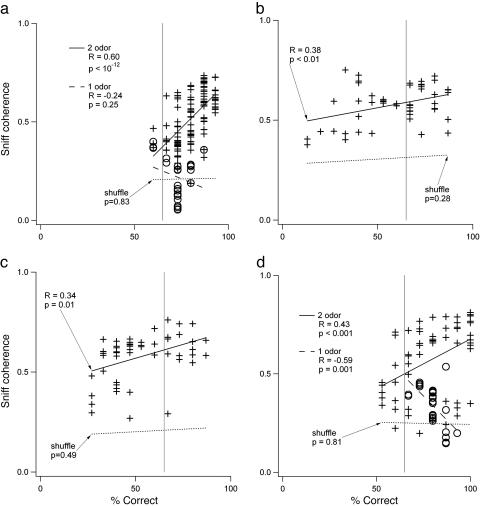
Performance and cognitive effort in humans have recently been related to amplitude and multisite coherence of alpha (7-12 Hz) and theta (4-7 Hz) band electroencephalogram oscillations. I examined this phenomenon in rats by using theta band oscillations of the local field potential to signify sniffing as a sensorimotor process. Olfactory bulb (OB) theta oscillations are coherent with those in the dorsal hippocampus (HPC) during odor sniffing in a two-odor olfactory discrimination task. Coherence is restricted to the high-frequency theta band (6-12 Hz) associated with directed sniffing in the OB and type 1 theta in the HPC. Coherence and performance fluctuate on a time scale of several minutes. Coherence magnitude is positively correlated with performance in the two-odor condition but not in extended runs of single odor conditional-stimulus-positive trials. Simultaneous with enhanced OB-HPC theta band coherence during odor sniffing is a significant decrease in lateral entorhinal cortex (EC)-HPC and OB-EC coherence, suggesting that linkage of the olfactory and hippocampal theta rhythms is not through the synaptic relay from OB to HPC in the lateral EC. OB-HPC coupling at the sniffing frequency is proposed as a mechanism underlying olfactory sensorimotor effort as a cognitive process.
Figures
Similar articles
-
Directional coupling from the olfactory bulb to the hippocampus during a go/no-go odor discrimination task.J Neurophysiol. 2010 May;103(5):2633-41. doi: 10.1152/jn.01075.2009. Epub 2010 Feb 17. J Neurophysiol. 2010. PMID: 20164392 Free PMC article.
-
An olfacto-hippocampal network is dynamically involved in odor-discrimination learning.J Neurophysiol. 2007 Oct;98(4):2196-205. doi: 10.1152/jn.00524.2007. Epub 2007 Aug 15. J Neurophysiol. 2007. PMID: 17699692
-
Olfactory bulb drives respiration-coupled beta oscillations in the rat hippocampus.Eur J Neurosci. 2018 Oct;48(8):2663-2673. doi: 10.1111/ejn.13665. Epub 2017 Sep 14. Eur J Neurosci. 2018. PMID: 28833629
-
Circuit oscillations in odor perception and memory.Prog Brain Res. 2014;208:223-51. doi: 10.1016/B978-0-444-63350-7.00009-7. Prog Brain Res. 2014. PMID: 24767485 Review.
-
[Involvement of the olfactory system in learning and memory: a close correlation between the olfactory deficit and the course of Alzheimer's disease?].Yakubutsu Seishin Kodo. 1991 Aug;11(4):223-35. Yakubutsu Seishin Kodo. 1991. PMID: 1799095 Review. Japanese.
Cited by
-
ϒ spike-field coherence in a population of olfactory bulb neurons differentiates between odors irrespective of associated outcome.J Neurosci. 2015 Apr 8;35(14):5808-22. doi: 10.1523/JNEUROSCI.4003-14.2015. J Neurosci. 2015. PMID: 25855190 Free PMC article.
-
Oscillations Trumped by Behavior: A Link between Sensory and Direct Electrical Stimulation of Cortical Activity.Front Neurosci. 2010 Sep 15;4:39. doi: 10.3389/fnins.2010.00039. eCollection 2010. Front Neurosci. 2010. PMID: 20859523 Free PMC article. No abstract available.
-
Learning improves decoding of odor identity with phase-referenced oscillations in the olfactory bulb.Elife. 2020 Jan 28;9:e52583. doi: 10.7554/eLife.52583. Elife. 2020. PMID: 31990271 Free PMC article.
-
How global are olfactory bulb oscillations?J Neurophysiol. 2010 Sep;104(3):1768-73. doi: 10.1152/jn.00478.2010. Epub 2010 Jul 21. J Neurophysiol. 2010. PMID: 20660428 Free PMC article.
-
COVID-19 and olfactory dysfunction: a looming wave of dementia?J Neurophysiol. 2022 Aug 1;128(2):436-444. doi: 10.1152/jn.00255.2022. Epub 2022 Jul 27. J Neurophysiol. 2022. PMID: 35894511 Free PMC article. Review.
References
-
- Razoumnikova, O. M. (2000) Brain Res. Cognit. Brain Res. 10, 11-18. - PubMed
-
- Weiss, S., Muller, H. M. & Rappelsberger, P. (2000) NeuroReport 11, 2357-2361. - PubMed
-
- Stowell, H. (1990) Int. J. Neurosci. 53, 261-263. - PubMed
-
- Vernon, D., Egner, T., Cooper, N., Compton, T., Neilands, C., Sheri, A. & Gruzelier, J. (2003) Int. J. Psychophysiol. 47, 75-85. - PubMed
Publication types
MeSH terms
LinkOut - more resources
Full Text Sources
Miscellaneous
