Comparative Study
. 2005 Mar;88(3):2234-49.
doi: 10.1529/biophysj.104.046284.

Modeling regulation of cardiac KATP and L-type Ca2+ currents by ATP, ADP, and Mg2+

Collaborators, Affiliations
Comparative Study

Modeling regulation of cardiac KATP and L-type Ca2+ currents by ATP, ADP, and Mg2+

Anushka Michailova et al. Biophys J. 2005 Mar.

Abstract

Changes in cytosolic free Mg(2+) and adenosine nucleotide phosphates affect cardiac excitability and contractility. To investigate how modulation by Mg(2+), ATP, and ADP of K(ATP) and L-type Ca(2+) channels influences excitation-contraction coupling, we incorporated equations for intracellular ATP and MgADP regulation of the K(ATP) current and MgATP regulation of the L-type Ca(2+) current in an ionic-metabolic model of the canine ventricular myocyte. The new model: 1), quantitatively reproduces a dose-response relationship for the effects of changes in ATP on K(ATP) current, 2), simulates effects of ADP in modulating ATP sensitivity of K(ATP) channel, 3), predicts activation of Ca(2+) current during rapid increase in MgATP, and 4), demonstrates that decreased ATP/ADP ratio with normal total Mg(2+) or increased free Mg(2+) with normal ATP and ADP activate K(ATP) current, shorten action potential, and alter ionic currents and intracellular Ca(2+) signals. The model predictions are in agreement with experimental data measured under normal and a variety of pathological conditions.


Figures

FIGURE 1
FIGURE 1
Schematic diagram illustrating Ca2+ and Mg2+ buffering and transport by ATP and ADP, adenine nucleotides regulation of ionic channels and pump, and electrophysiology in ventricular myocyte. See Appendix II for the notations of the parameters used throughout the study.
FIGURE 2
FIGURE 2
Schematic representation of Kir6.2 and SUR2A subunit stoichiometry in cardiac octameric KATP channel (A). It is assumed that the single ATP molecule (•) is sufficient to close the channel and that the binding of 2MgADP molecules (▴) to one SUR2A subunit increases the channel open probability. Panel B shows formula image and action-potential time courses (9–10 s; 1-Hz frequency) generated with original ionic-metabolic model (dashed lines) and with reduced-order model of the L-type Ca2+ channel (solid lines). Normal condition (1) is 5 mM formula image 200 μM formula image 0.5 mM formula image; metabolic inhibition (2) is 3 mM formula image 3 mM formula image 0.68 mM formula image
FIGURE 3
FIGURE 3
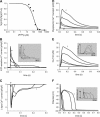
Effects of ATP on cardiac EC coupling. (A) Dose-response relationship for the effects of free ATP (or total ATP from 0 to 10 mM) on relative KATP channel current (formula image). The solid line was fitted to experimental data by Nichols et al. (1991a) (▪) with formula image = 600 μM, formula image = 400 μM, formula image = 0.05 mS/μF, formula image = 0.08, formula image = 0.89. (BF) Time courses of formula image and action potential. Letters (i–v) correspond to 5, 4, 3, 2, and 0.5 mM formula image respectively. Insets show experimental recordings (Fig. 4 B in Nichols et al., 1991a) of superimposed formula image (panel B), twitches (panel E), and action potentials (panel F) for the effects of injection of stimulated KATP current. Letters (i–v) in insets correspond to digitized experimental plots (i, ii, vii, x, xi). Simulations are generated in response to 1-Hz pulse and model outputs at the tenth stimulus are shown only. formula image 200 μM, formula image 4.84 mM, formula image4 mM, formula image 138 mM, formula image 2 mM.
FIGURE 4
FIGURE 4
Dependence of KATP channel activity on ADP in the presence of Mg2+. Calculated ATP-sensitive K+ currents (5–10 s) in response to 1-Hz stimuli are shown. (A) Top, middle, and bottom traces show the shift in the sensitivity of KATP channels to ATP caused by increases in free ADP. (B) Effects of 1 mM increase or decrease in total ATP from 5 mM in the absence of ADP on KATP current. (C) Effects of 100 μM increase or decrease in total ADP from 200 μM in the absence of ATP on KATP current. formula image 4.84 mM, formula image 4 mM, formula image 138 mM, formula image 2 mM.
FIGURE 5
FIGURE 5
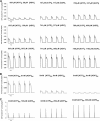
Absolute levels of ATP and ADP regulate cardiac EC coupling independently of ATP/ADP ratio. Panels AD show effects of 50% simultaneous increase or decrease in total ATP and total ADP with formula image unchanged on formula image and action potential (9–10 s) in response to 1-Hz periodic pulse. (Dashed line) formula image 7.5 mM, formula image 300 μM. (Solid line) formula image 5 mM, formula image 200 μM. (Dashed-dotted line) formula image 2.5 mM, formula image 100 μM. Total Mg2+ ∼ 4.84 mM, ATP/ADP = 25.
FIGURE 6
FIGURE 6
Effects of cytosolic Mg2+ on cardiac EC coupling. Panels AD show effects of changes in cytosolic Mg2+ on formula image and action potential (9–10 s) in response to 1-Hz periodic pulse. (Dashed-dotted line) formula image 0.2 mM, total Mg2+ 3.73 mM. (Solid line) formula image 0.5 mM, total Mg2+ 4.84 mM. (Dashed line) formula image 1.8 mM, total Mg2+ 6.7 mM. Total ATP 5 mM, total ADP 200 μM. Bottom trace in panel A shows an expanded view of the peak of L-type Ca2+ current. Inset in panel D is from Agus et al. (1989) and shows the suppressive effect of elevated Mg2+ levels on the experimentally recorded action potentials. The first, second, and last experimental plots (right to left) are digitized.
FIGURE 7
FIGURE 7
Panels AH show model outputs in response to 1-Hz periodic pulse (9–10 s). Bottom trace in panel E shows an expanded view of the peak of L-type Ca2+ current. Normal conditions are formula image 6.8 mM, formula image 15 μM, formula image 2 mM (solid line). Ischemia (40 s) is formula image 5.4 mM, formula image 30 μM, formula image 3.165 mM (dashed line). Ischemia (10 min) is formula image 4.6 mM, formula image 99 μM, formula image 3.55 mM (dashed-dotted line). Total Mg2+ 8.56 mM.

References

    1. Aguilar-Bryan, L., C. G. Nichols, S. W. Wechsler, J. P. Clement, A. E. Boyd, G. Gonzales, H. Herrera-Sosa, K. Nguy, J. Bryan, and D. A. Nelson. 1995. Cloning of the beta cell high-affinity sulfonylurea receptor: a regulation of insulin secretion. Science. 268:423–426. - PubMed
    1. Agus, Z. A., E. Kelepouris, I. Dukes, and M. Morad. 1989. Cytosolic magnesium modulates calcium channel activity in mammalian ventricular cells. Am. J. Physiol. 256:C425–C455. - PubMed
    1. Albitz, R., H. Kammermeier, and B. Nilius. 1990. Free energy of ATP-hydrolysis fails to affect ATP-dependent potassium channels in isolated mouse ventricular cells. J. Mol. Cell. Cardiol. 22:183–190. - PubMed
    1. Alekseev, A. E., M. E. Kennedy, B. Navarro, and A. Terzic. 1997. Burst kinetics of co-expressed Kir6.2/SUR1 clones: comparison of recombinant with native ATP-sensitive K+ channel behavior. J. Membr. Biol. 159:161–168. - PubMed
    1. Ashcroft, F. M., and S. J. Ashcroft. 1990. Properties and functions of ATP-sensitive K-channels. Cell. Signal. 2:197–214. - PubMed

MeSH terms

LinkOut - more resources