. 2005 Mar 1;33(4):1309-22.
doi: 10.1093/nar/gki269. Print 2005.

A family of RS domain proteins with novel subcellular localization and trafficking

Affiliations

A family of RS domain proteins with novel subcellular localization and trafficking

Steven J Kavanagh et al. Nucleic Acids Res. .

Abstract

We report the sequence, conservation and cell biology of a novel protein, Psc1, which is expressed and regulated within the embryonic pluripotent cell population of the mouse. The Psc1 sequence includes an RS domain and an RNA recognition motif (RRM), and a sequential arrangement of protein motifs that has not been demonstrated for other RS domain proteins. This arrangement was conserved in a second mouse protein (BAC34721). The identification of Psc1 and BAC34721 homologues in vertebrates and related proteins, more widely throughout evolution, defines a new family of RS domain proteins termed acidic rich RS (ARRS) domain proteins. Psc1 incorporated into the nuclear speckles, but demonstrated novel aspects of subcellular distribution including localization to speckles proximal to the nuclear periphery and localization to punctate structures in the cytoplasm termed cytospeckles. Integration of Psc1 into cytospeckles was dependent on the RRM. Cytospeckles were dynamic within the cytoplasm and appeared to traffic into the nucleus. These observations suggest a novel role in RNA metabolism for ARRS proteins.


Figures
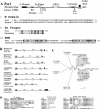
Figure 1
Figure 1
Arrangement of conserved elements in Psc1 and ARRS proteins and homologues. (A) Diagrammatic representation of conserved protein motifs and domains within the 1005 amino acid sequence of Psc1. N domain; RS domain, arginine/serine dipeptide repeat; Zn finger, C(X)8C(X)5C(X)3H zinc finger motif; P, proline-rich region; PG, proline/glycine repeats; RRM, RNA binding motif; C domain, shared region of homology between ARRS proteins and homologues; RG, arginine/glycine repeats; acidic rich, C-terminal aspartate/glutamate-rich region; (i–iii). Homologies between the Psc1 N domain (i), Zn finger (ii) and RRM (iii) and proteins of known function or consensus derived from the NCBI conserved domain database of known Zn finger or RNA binding domains. Identical residues shown as bold. The RRM motifs P(X)3N(X)7HF(X)2FG(X)3N and A(X)2A(X)2S(X)5NNRFI(X)3W that are unique to ARRS proteins and homologues are boxed (iii). (B) Alignment of representative ARRS proteins and homologues with Psc1. Representative proteins from human, mouse, amphibian, fruit fly, mosquito, nematode worm and slime-mould. Conservation extends to all ARRS proteins including fish, chicken and rat (data not shown). Elements are drawn to scale and the positions of motifs described in (A) are indicated. Percentages indicate degree of amino acid identity to the equivalent domain in Psc1. (C) Unrooted distance neighbour-joining tree showing a phylogeny of ARRS proteins. Sequences for predicted ARRS proteins from fish (accession codes SINFRUP00000133230; SINFRUP00000133187), chicken (accession codes ENSGALG00000007516; ENSGALG00000016910,) and rat (accession code ENSRNOG00000009836) were taken from the ENSEMBL database (). Sequences for mouse (accession code BAC34721), human (accession codes KIAA1311 and AAH41655), amphibian (Xenopus laevis; AAH43744), fruit fly (D.melanogaster, NP_609976), mosquito (A.gambiae, XP_318628), nematode worm (C.elegans, NP_498234) and slime-mould (D.discoideum, AAO51188), were taken from the NCBI database (). Sequences were aligned using ‘CLUSTAL W’ (29) with the BLOSUM 62 scoring matrix, with gap opening and gap extension penalties of 10.0 and 0.1, respectively, followed by some minor manual corrections to conform to known structural features. The tree was constructed with PAUP* (76) using standard distances and mean character differences. High confidence was confirmed via congruent tree topology using Parsimony treatment (PAUP*, data not shown) and high resampling statistics indicated at nodes (1000 bootstrap replications represented as percentage values; distance above and Parsimony below). Ellipses (shaded) define two proteins, Psc1 and BAC34721 clades, the result of a putative gene duplication (*) that occurs in the vertebrate lineage. Shown are clades composed of orthologous proteins from vertebrate and invertebrate organisms. Scale bar indicates a distance of 0.1 amino acid substitutions per position in the sequence. (D) Sequence comparison of RS domain, proline-rich and acidic rich elements in ARRS proteins and homologues. The asterisk in the sequence of AA051188 represents an intervening 11 amino acids not shown. All other sequences are contiguous with periods used to align areas of similarity. DNE; does not exist.
Figure 2
Figure 2
Subcellular localization of Psc1. (A) Nuclear localization: Psc1-HA transfected COS-1 cell (i) visualized with anti-HA FITC antibody (ii) and anti-SC35 antibody (iii). (iv), Merged image of (ii) and (iii). Left arrow indicates Psc1 nuclear speckles that do not contain SC35 and tend to be associated with the nuclear periphery, right arrow indicates Psc1 and SC35 colocalization in yellow. (v), merged image of panels (i) and (iv). The arrow shows the proximity to the nuclear membrane of Psc1-containing nuclear speckles that do not contain SC35. (B) Cytoplasmic localization: (i), Psc1-HA transfected COS-1 cell visualized with anti-HA FITC antibody showing cytoplasmic localization in the absence of nuclear localization. (ii), GFP–Psc1 transfected COS-1 cell showing nuclear and cytoplasmic localization. (C) Subcellular distribution of GFP–Psc1 within a population of GFP–Psc1 transfected COS-1 cells. Error bars indicate standard deviation. (D) COS-1 cells were co-transfected with Psc1-HA and GFP–SF2/ASF and visualized with anti-HA TRITC (lower right) or by direct fluorescence (lower left). The top panel shows merged images of the lower panels. (E) Specificity of purified polyclonal anti-Psc1 antibody raised against Psc1 amino acids 635–713. Western blot analysis of: lane 1, untransfected COS-1 cells (107) were lysed and the pellet fraction probed with purified anti-Psc1 antibody; lane 2, 5 μl of 50 μl unprimed rabbit reticulocyte lysate transcription/translation reaction probed with anti-FLAG monoclonal antibody; lane 3, 5 μl of 50 μl His-Psc1-Flag primed rabbit reticulocyte lysate transcription/translation reaction probed with anti-FLAG monoclonal antibody. (F) Endogenous Psc1 in COS-1 cells. Untransfected COS-1 cells were visualized with anti-Psc1 antibody. Panels show endogenous Psc1 in nuclear speckles in the absence (i) or presence (ii) of cytoplasmic speckles. (iii) Merged image of COS-1 cell visualized with anti-SC35 (red, lower left panel), and anti-Psc1 (green, lower right panel). Arrows indicate endogenous Psc1-containing nuclear speckles that do not contain SC35. Nuclei were stained with 5 μg/ml Hoechst 33258 (lower panels i and ii). Size bars represent 10 μm. Fluorescence images in (A) were obtained using confocal microscopy. All other images were obtained by conventional microscopy.
Figure 3
Figure 3
Real time analysis of GFP–Psc1 motility in COS-1 cells. GFP–Psc1 transfected COS-1 cells were analysed 10 h post transfection by confocal microscopy. Images were captured at 15–30s intervals. Cells were stained with Hoechst 33342 to identify the nucleus and maintained in fresh growth medium at 37°C for the timecourse of the experiment. (A) Motility of Psc1 nuclear speckles. The arrow indicates speckle motility and budding across the nucleus. The lower arrow in panel 4 indicates a speckle originated from a budding event. Panels 1–6 were captured at 0, 30, 90, 270, 420 and 540s, respectively. (B–D) Motility of Psc1 cytospeckles. (B) Random and stationary cytospeckle motility. The cytospeckle indicated by the arrow in panels 1–12 shows a change of direction in panel 10. Upper arrow in panel 12 shows a stationary cytospeckle. Panels 1–12 were captured at 0, 15, 30, 45, 75, 90, 105, 120, 150, 165, 210 and 225, respectively. (C) Directed motility and fusion of cytospeckles. The cytospeckle indicated by the arrow moves directionally away from the nucleus and fuses with distant cytoplasmic speckles. Panels 1–5 were captured at 0, 630, 780, 900 and 930s, respectively. (D) Motility of Psc1 cytospeckles, (arrow, panels 1–8). Panel 4 shows the speckle move slightly away from the nucleus before apparent nuclear translocation in panels 5–8. Panels 1–8 were captured at 0, 15, 45, 90, 105, 120, 135 and 150s, respectively. GFP was visualized by direct fluorescence under excitation at 480 nm using confocal microscopy. Size bars represent 5 μm.
Figure 4
Figure 4
The role of the Psc1 RS domain in Psc1 subcellular localization. (A) Subcellular distribution of Psc1 protein in Psc1, GFP–Psc1ΔRS and GFP–RS transfected COS-1 cells. Error bars indicate standard deviation. (B) COS-1 cell transfected with GFP–Psc1ΔRS and visualized by direct fluorescence (lower right). Nuclei stained with Hoechst 333258 (lower left). The top panel shows merged images. (C) COS-1 cell transfected with GFP–Psc1ΔRS and visualized by direct fluorescence (lower right) or anti-SC35 antibody (lower left). Top panel shows merged images. (D) COS-1 cell co-transfected with GFP–Psc1ΔRS and Psc1-HA, and visualized by direct fluorescence (lower right) or anti-HA TRITC (lower left). Top panel shows merged images. (E) COS-1 cell transfected with GFP–RS and visualized by direct fluorescence (lower right) or anti SC35 antibody (lower left). Top panel shows merged images. (F) COS-1 cell transfected with GFP–RS and visualized by direct fluorescence showing diffuse distribution in the nucleus and the cytoplasm as observed in 30% of cells. All images were captured using conventional microscopy. Size bars represent 10 μm.
Figure 5
Figure 5
The role of the Psc1 RRM in Psc1 subcellular localization. (A) RNA binding assay. GST–RRM and GST were expressed in bacteria and purified. An aliquot of 1 μg of the protein was cross linked for 10 min at 254 nm with [32P]UTP adenovirus RNA, treated with RNase A and analysed by 12.5% SDS–PAGE followed by autoradiography. Unlabelled ES cell total RNA was used as a competitor. The positions of the GST–RRM and GST proteins are indicated. (B) Subcellular distribution of Psc1 protein in Psc1, GFP–Psc1ΔRRM and GFP–RRM transfected COS-1 cells. Error bars indicate standard deviation. (C) COS-1 cell transfected with GFP–Psc1ΔRRM visualized by direct fluorescence (lower right) or anti-SC35 antibody (top right). Left panel shows merged images. (D) COS-1 cell transfected with GFP–RRM visualized by direct fluorescence (lower right) or anti-SC35 antibody (top right). Left panel shows merged images (E) COS-1 cell cotransfected with GFP–Psc1ΔRRM and Psc1–HA visualized by direct fluorescence (lower right) or anti-HA TRITC (top right). Left panels show merged images. (F) COS-1 cell cotransfected with GFP–RRM and Psc1–HA and visualized by direct fluorescence (lower right) or anti-HA TRITC (top right). Left panel shows merged images. Size bars represent 10 μm. Panel E is a confocal image, all other images were obtained by conventional microscopy.
Figure 6
Figure 6
The role of C-terminal elements in Psc1 subcellular localization. (A) Subcellular distribution of Psc1 protein in Psc1, GFP–Psc1ΔCD and GFP–CD transfected COS-1 cells. Error bars indicate standard deviation. (B) COS-1 cell cotransfected with GFP–Psc1ΔCD and Psc1–HA, visualized by direct fluorescence (lower right) or anti-HA TRITC (lower left). Top panel shows merged images. The nucleus is outlined by a dotted line. (C) COS-1 cell transfected with GFP–Psc1ΔCD, visualized by direct fluorescence (lower right) or anti-SC35 antibody (lower left). GFP–Psc1ΔCD is restricted to the nucleus in this example. Top panel shows merged images. (D) Representative cytoplasmic section of COS-1 cells transfected with GFP–CD and visualized by anti α-tubulin antibody (i) or by direct fluorescence (ii). Merged images shown in (iii). Size bars represent 10 μm. All images were obtained by conventional microscopy.

Similar articles

Cited by

References

    1. Boucher L., Ouzounis C.A., Enright A.J., Blencowe B.J. A genome-wide survey of RS domain proteins. RNA. 2001;7:1693–1701. - PMC - PubMed
    1. Graveley B.R. Sorting out the complexity of SR protein functions. RNA. 2000;6:1197–1211. - PMC - PubMed
    1. Tacke R., Manley J.L. Determinants of SR protein specificity. Curr. Opin. Cell Biol. 1999;11:358–362. - PubMed
    1. Valcarcel J., Green M.R. The SR protein family: pleiotropic functions in pre-mRNA splicing. Trends Biochem. Sci. 1996;21:296–301. - PubMed
    1. Fu X.-D. The superfamily of arginine/serine rich splicing factors. RNA. 1995;1:663–680. - PMC - PubMed

Publication types

MeSH terms

Associated data