

Mithramycin forms a stable dimeric complex by chelating with Fe(II): DNA-interacting characteristics, cellular permeation and cytotoxicity
- PMID: 15741187
- PMCID: PMC552963
- DOI: 10.1093/nar/gki276
Mithramycin forms a stable dimeric complex by chelating with Fe(II): DNA-interacting characteristics, cellular permeation and cytotoxicity
Abstract
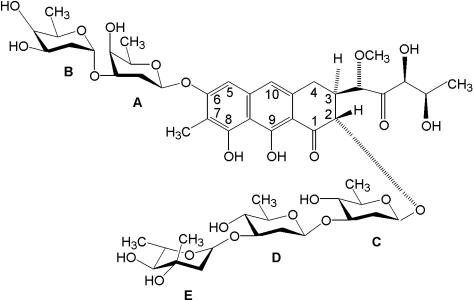
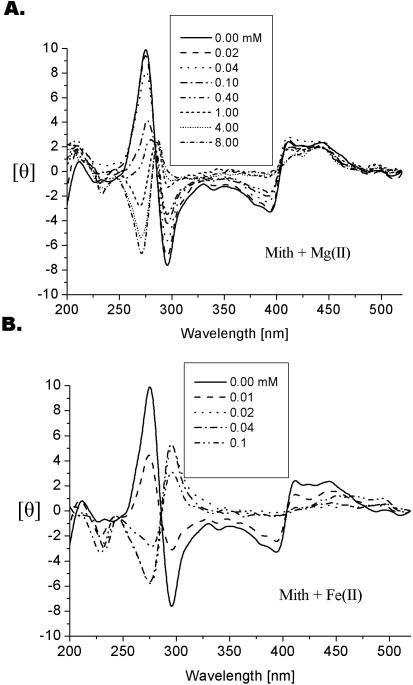
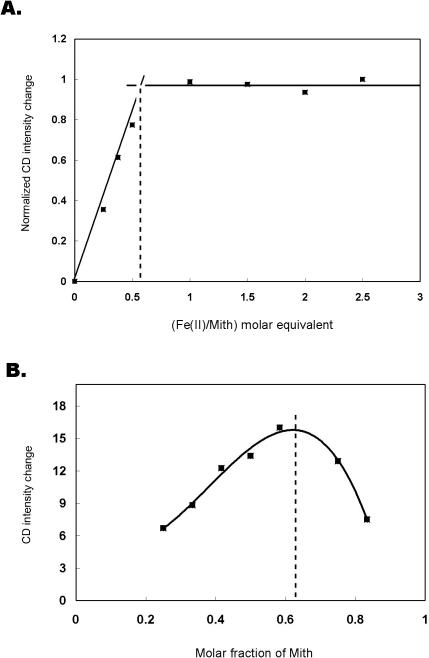
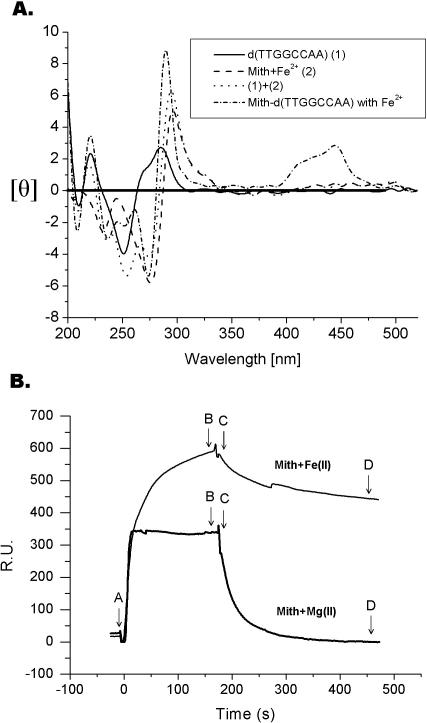
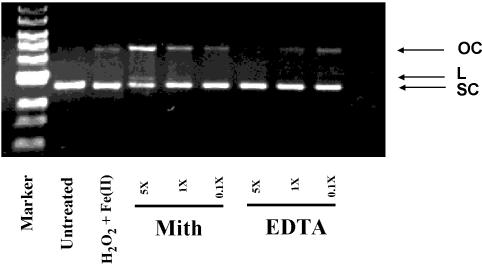
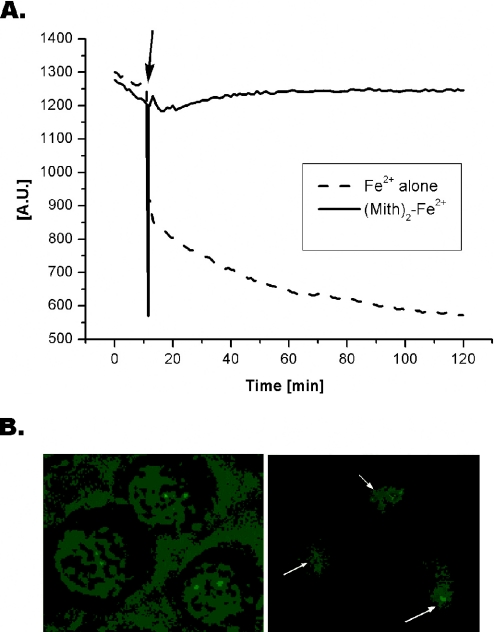
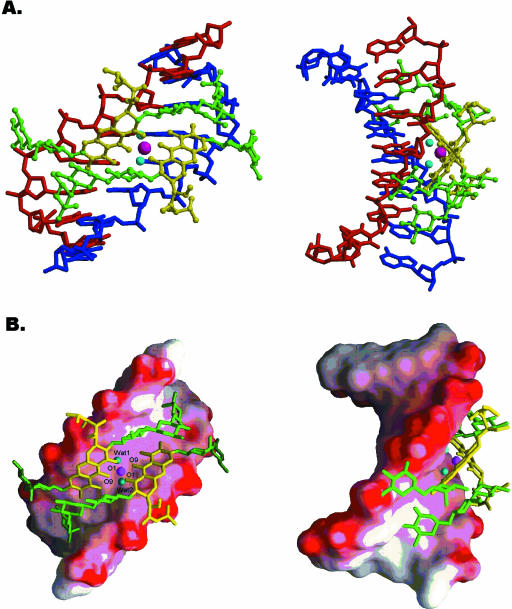
Mith (mithramycin) forms a 2:1 stoichiometry drug-metal complex through the chelation with Fe(II) ion as studied using circular dichroism spectroscopy. The binding affinity between Mith and Fe(II) is much greater than other divalent metal ions, including Mg(II), Zn(II), Co(II), Ni(II) and Mn(II). The [(Mith)2-Fe(II)] complex binds to DNA and induces a conformational change of DNA. Kinetic analysis of surface plasmon resonance studies revealed that the [(Mith)2-Fe(II)] complex binds to DNA duplex with higher affinity compared with the [(Mith)2-Mg(II)] complex. A molecular model of the Mith-DNA-Metal(II) complex is presented. DNA-break assay showed that the [(Mith)2-Fe(II)] complex was capable of promoting the one-strand cleavage of plasmid DNA in the presence of hydrogen peroxide. Intracellular Fe(II) assays and fluorescence microscopy studies using K562 indicated that this dimer complex maintains its structural integrity and permeates into the inside of K562 cells, respectively. The [(Mith)2-Fe(II)] complex exhibited higher cytotoxicity than the drug alone in some cancer cell lines, probably related to its higher DNA-binding and cleavage activity. Evidences obtained in this study suggest that the biological effects caused by the [(Mith)2-Fe(II)] complex may be further explored in the future.
Figures
Similar articles
-
Elucidation of the DNA-interacting properties and anticancer activity of a Ni(II)-coordinated mithramycin dimer complex.Biometals. 2013 Feb;26(1):1-12. doi: 10.1007/s10534-012-9589-8. Epub 2012 Oct 25. Biometals. 2013. PMID: 23097078
-
Effects of polyamines on the DNA-reactive properties of dimeric mithramycin complexed with cobalt(II): implications for anticancer therapy.Biochemistry. 2009 Jun 9;48(22):4691-8. doi: 10.1021/bi900092w. Biochemistry. 2009. PMID: 19368394
-
Studies of sequence-specific DNA binding, DNA cleavage, and topoisomerase I inhibition by the dimeric chromomycin A3 complexed with Fe(II).Biochemistry. 2008 May 20;47(20):5493-502. doi: 10.1021/bi701915f. Epub 2008 Apr 22. Biochemistry. 2008. PMID: 18426223
-
Iron-responsive riboswitches.Curr Opin Chem Biol. 2022 Jun;68:102135. doi: 10.1016/j.cbpa.2022.102135. Epub 2022 Apr 12. Curr Opin Chem Biol. 2022. PMID: 35427920 Free PMC article. Review.
-
Harm reduction of tobacco: Mith or reality?Med Clin (Barc). 2025 May 9;164(9):499-503. doi: 10.1016/j.medcli.2024.12.009. Epub 2025 Feb 7. Med Clin (Barc). 2025. PMID: 39922735 Review. English, Spanish. No abstract available.
Cited by
-
Synthesis, metal ion binding, and biological evaluation of new anticancer 2-(2'-hydroxyphenyl)benzoxazole analogs of UK-1.Bioorg Med Chem. 2008 Feb 15;16(4):1775-83. doi: 10.1016/j.bmc.2007.11.019. Epub 2007 Nov 12. Bioorg Med Chem. 2008. PMID: 18037301 Free PMC article.
-
Conformational changes in DNA upon ligand binding monitored by circular dichroism.Int J Mol Sci. 2012;13(3):3394-3413. doi: 10.3390/ijms13033394. Epub 2012 Mar 12. Int J Mol Sci. 2012. PMID: 22489158 Free PMC article. Review.
-
Inhibition of a Zn(II)-containing enzyme, alcohol dehydrogenase, by anticancer antibiotics, mithramycin and chromomycin A3.J Biol Inorg Chem. 2009 Mar;14(3):347-59. doi: 10.1007/s00775-008-0451-y. Epub 2008 Nov 26. J Biol Inorg Chem. 2009. PMID: 19034537
-
Generation of new derivatives of the antitumor antibiotic mithramycin by altering the glycosylation pattern through combinatorial biosynthesis.Chembiochem. 2008 Sep 22;9(14):2295-304. doi: 10.1002/cbic.200800299. Chembiochem. 2008. PMID: 18756551 Free PMC article.
-
The crucial role of divalent metal ions in the DNA-acting efficacy and inhibition of the transcription of dimeric chromomycin A3.PLoS One. 2012;7(9):e43792. doi: 10.1371/journal.pone.0043792. Epub 2012 Sep 12. PLoS One. 2012. PMID: 22984445 Free PMC article.
References
-
- Slavik M., Carter S.K. Chromomycin A3, mithramycin, and olivomycin: antitumor antibiotics of related structure. Adv. Pharmacol. Chemother. 1975;12:1–30. - PubMed
-
- Kennedy B.J. Mithramycin therapy in testicular cancer. J. Urol. 1972;107:429–432. - PubMed
-
- Du Priest R.W., Jr, Fletcher W.S. Chemotherapy of testicular germinal tumors. Oncology. 1973;28:147–163. - PubMed
-
- Elias E.G., Evans J.T. Mithramycin in the treatment of Paget's disease of bone. J. Bone Joint Surg. Am. 1972;54:1730–1736. - PubMed
-
- Goldberg I.H., Friedman P.A. Antibiotics and nucleic acids. Annu. Rev. Biochem. 1971;40:775–810. - PubMed
Publication types
MeSH terms
Substances
LinkOut - more resources
Full Text Sources
Other Literature Sources
