

Effects of the human immunodeficiency virus-protease inhibitor, ritonavir, on basal and catecholamine-stimulated lipolysis
- PMID: 15741249
- PMCID: PMC1350765
- DOI: 10.1210/jc.2004-2194
Effects of the human immunodeficiency virus-protease inhibitor, ritonavir, on basal and catecholamine-stimulated lipolysis
Abstract
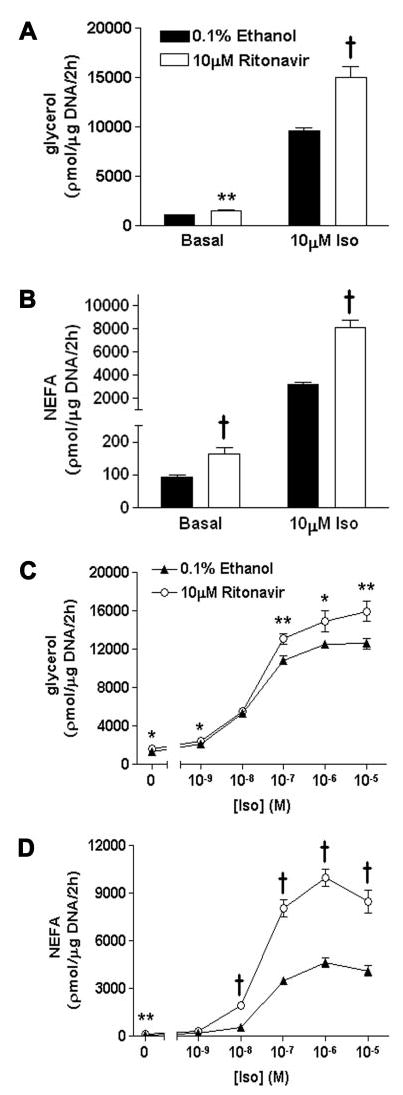
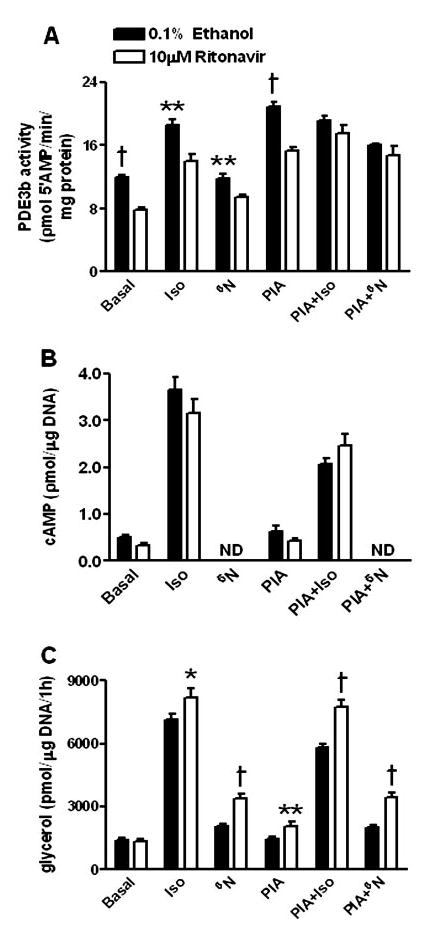
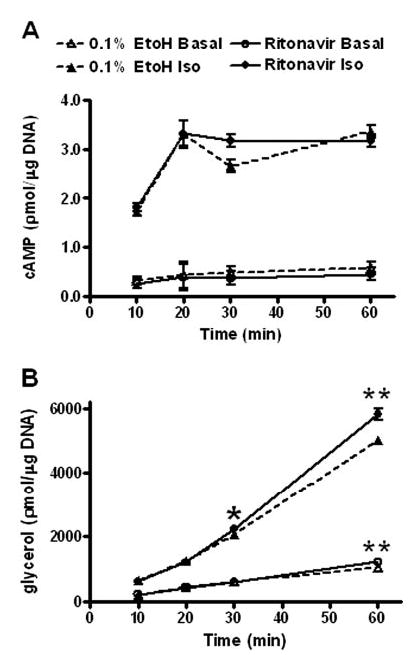
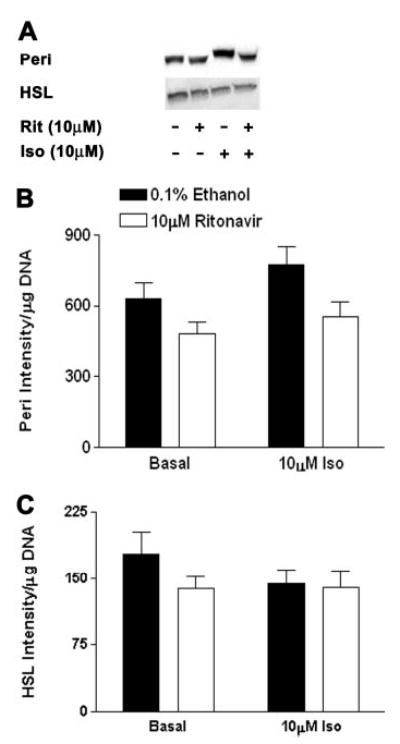
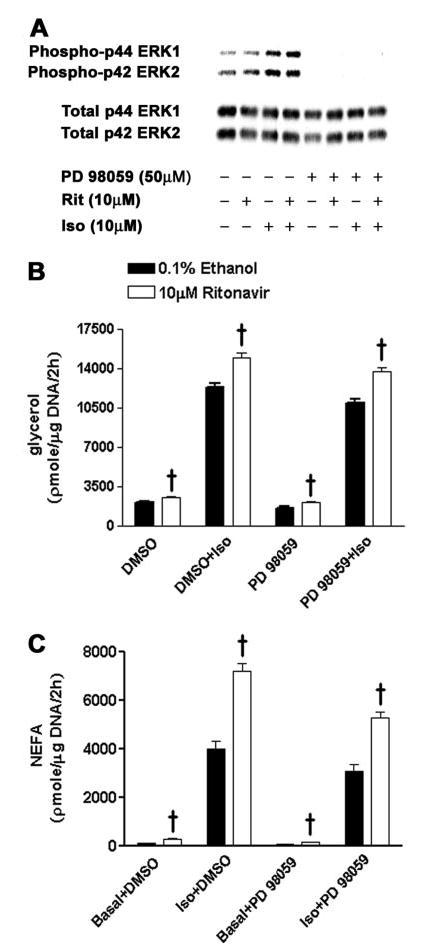
Several of the aspartic acid protease inhibitors used to treat HIV infection increase basal lipolysis in adipocytes, but the cellular mechanisms leading to this augmentation are not well understood. We therefore studied the effects of chronic exposure to the HIV protease inhibitor, ritonavir, on the lipolytic cascade in 3T3-L1 adipocytes. Treatment of 3T3-L1 adipocytes with ritonavir for 14 d (during and after differentiation) enhanced basal, isoproterenol (Iso)-stimulated, and cAMP analog-stimulated lipolysis. Enhancement of lipolysis was observed after Iso at concentrations between 0.1 and 10 mum. Despite a significant decrease in cyclic nucleotide phosphodiesterase (PDE)3B activity and protein levels, there were no changes in Iso-stimulated intracellular cAMP, protein kinase A (PKA) expression, or PKA activity. Ritonavir-augmented lipolysis was also observed under conditions that reversed the effect on PDE3B activity via preincubation with 1 mum (-)-N(6)-(2-phenylisopropyl)adenosine. In ritonavir-treated cells, protein expression of the lipid droplet-protective protein, perilipin, was significantly decreased, whereas there was no change in hormone-sensitive lipase. Activation of ERK1/2 by Iso did not play a role in the augmentation. We conclude that ritonavir decreases PDE3B and perilipin protein expression and affects both basal and catecholamine-stimulated lipolysis in 3T3-L1 adipocytes primarily through actions at sites downstream of PKA.
Figures


Similar articles
-
Regulation of AMP-activated protein kinase by cAMP in adipocytes: roles for phosphodiesterases, protein kinase B, protein kinase A, Epac and lipolysis.Cell Signal. 2009 May;21(5):760-6. doi: 10.1016/j.cellsig.2009.01.015. Epub 2009 Jan 8. Cell Signal. 2009. PMID: 19167487 Free PMC article.
-
Selective effects of phosphodiesterase inhibitors on different phosphodiesterases, adenosine 3',5'-monophosphate metabolism, and lipolysis in 3T3-L1 adipocytes.Endocrinology. 1984 Oct;115(4):1262-8. doi: 10.1210/endo-115-4-1262. Endocrinology. 1984. PMID: 6207009
-
Tumor necrosis factor-alpha stimulates lipolysis in differentiated human adipocytes through activation of extracellular signal-related kinase and elevation of intracellular cAMP.Diabetes. 2002 Oct;51(10):2929-35. doi: 10.2337/diabetes.51.10.2929. Diabetes. 2002. PMID: 12351429
-
QRFP-43 inhibits lipolysis by preventing ligand-induced complex formation between perilipin A, caveolin-1, the catalytic subunit of protein kinase and hormone-sensitive lipase in 3T3-L1 adipocytes.Biochim Biophys Acta. 2015 May;1851(5):657-66. doi: 10.1016/j.bbalip.2015.02.005. Epub 2015 Feb 9. Biochim Biophys Acta. 2015. PMID: 25677823
-
C(2)-ceramide influences the expression and insulin-mediated regulation of cyclic nucleotide phosphodiesterase 3B and lipolysis in 3T3-L1 adipocytes.Diabetes. 2002 Mar;51(3):631-7. doi: 10.2337/diabetes.51.3.631. Diabetes. 2002. PMID: 11872660
Cited by
-
Balancing the fat: lipid droplets and human disease.EMBO Mol Med. 2013 Jul;5(7):973-83. doi: 10.1002/emmm.201100671. Epub 2013 Jun 6. EMBO Mol Med. 2013. PMID: 23740690 Free PMC article. Review.
-
Biology and pathobiology of lipid droplets and their potential role in the protection of the organ of Corti.Hear Res. 2015 Dec;330(Pt A):26-38. doi: 10.1016/j.heares.2015.04.015. Epub 2015 May 15. Hear Res. 2015. PMID: 25987503 Free PMC article. Review.
-
Effects of ritonavir on adipocyte gene expression: evidence for a stress-related response.Obesity (Silver Spring). 2008 Oct;16(10):2379-87. doi: 10.1038/oby.2008.350. Epub 2008 Jul 17. Obesity (Silver Spring). 2008. PMID: 18719645 Free PMC article.
-
Acylcarnitine Profiles in HIV-Exposed, Uninfected Neonates in the United States.AIDS Res Hum Retroviruses. 2016 Apr;32(4):339-48. doi: 10.1089/AID.2015.0112. Epub 2016 Jan 19. AIDS Res Hum Retroviruses. 2016. PMID: 26548585 Free PMC article.
-
Impact of antiretroviral therapy on growth, body composition and metabolism in pediatric HIV patients.Paediatr Drugs. 2010 Jun;12(3):187-99. doi: 10.2165/11532520-000000000-00000. Paediatr Drugs. 2010. PMID: 20481647 Review.
References
-
- Eron JJ., Jr HIV-1 protease inhibitors. Clin Infect Dis. 2000;30(Suppl 2):S160–S170. - PubMed
-
- Wlodawer A, Gustchina A. Structural and biochemical studies of retro-viral proteases. Biochim Biophys Acta. 2000;1477:16–34. - PubMed
-
- Rana KZ, Dudley MN. Human immunodeficiency virus protease inhibitors. Pharmacotherapy. 1999;19:35–59. - PubMed
-
- Wlodawer A, Vondrasek J. Inhibitors of HIV-1 protease: a major success of structure-assisted drug design. Annu Rev Biophys Biomol Struct. 1998;27:249–284. - PubMed
-
- Palella FJ, Jr, Delaney KM, Moorman AC, Loveless MO, Fuhrer J, Satten GA, Aschman DJ, Holmberg SD. Declining morbidity and mortality among patients with advanced human immunodeficiency virus infection. HIV Out-patient Study Investigators. N Engl J Med. 1998;338:853–860. - PubMed
Publication types
MeSH terms
Substances
Grants and funding
LinkOut - more resources
Full Text Sources
Miscellaneous
