. 2005 Mar 15;102(11):4114-9.
doi: 10.1073/pnas.0408376102. Epub 2005 Mar 1.

Rotavirus nonstructural protein 1 subverts innate immune response by inducing degradation of IFN regulatory factor 3

Affiliations

Rotavirus nonstructural protein 1 subverts innate immune response by inducing degradation of IFN regulatory factor 3

Mario Barro et al. Proc Natl Acad Sci U S A. .

Abstract

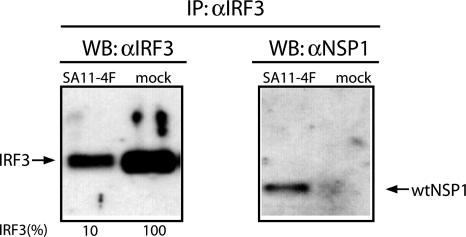
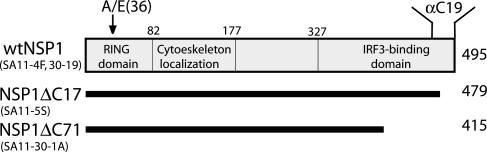
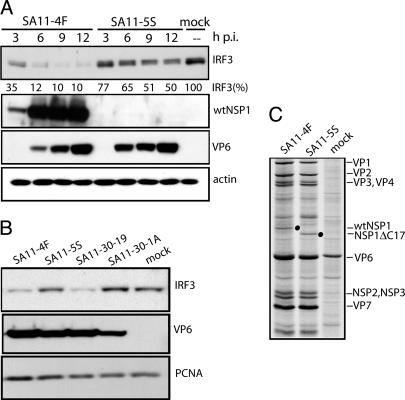
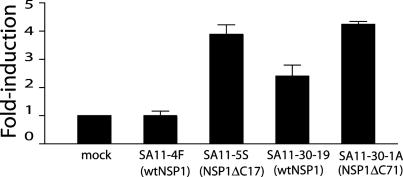
IFN regulatory factor 3 (IRF3), a constitutively expressed protein localizing largely to the cytoplasm, is a primary effector of the innate immune response. Infection can trigger the phosphorylation, dimerization, and nuclear translocation of IRF3, where the factor stimulates the expression and release of IFN. In this study, we determined that the rotavirus gene 5 product, nonstructural protein 1 (NSP1), interacts with IRF3 in the infected cell. To understand the importance of the interaction, we compared IRF3 activation by rotaviruses expressing wild-type and C-truncated forms of NSP1. The analysis showed that IRF3 underwent dimerization and nuclear translocation and stimulated IFN promoter activity in infected cells expressing truncated NSP1. In contrast, infected cells expressing wild-type NSP1 were characterized by the rapid degradation of IRF3 during the replication cycle, severe decreases in IRF3 dimerization and nuclear translocation, and lack of IFN promoter activity. The implication of these results, that wild-type NSP1 is an antagonist of the IFN-signaling pathway, was confirmed in transient expression assays, which showed that wild-type NSP1, but not the C-truncated protein, induced the degradation of IRF3 fusion proteins. Related experiments indicated that NSP1 mediates IRF3 degradation through a proteasome-dependent pathway. The critical role of NSP1 in promoting cell-to-cell spread of rotavirus was demonstrated by using gene 5-specific short interfering RNAs in plaque assays. Although several viruses have been described that subvert the innate immune response by preventing IRF3 activation, rotavirus is identified as one that accomplishes this task by inducing the degradation of IRF3.


Figures

Fig. 1.
Fig. 1.
NSP1–IRF3 complexes formed in infected cells. IRF3-specific antiserum was used to prepare immunoprecipitates from SA11-4F- or mock-infected Caco-2 cells. The precipitates were analyzed by using Western blot assay with IRF3 or NSP1(C19)-specific antiserum. Intensities (percent) of IRF3 bands were determined with a PhosphorImager and normalized to 100% for IRF3 from mock-infected cells.
Fig. 2.
Fig. 2.
Full-length (wt) and C-truncated (ΔC17 and ΔC71) NSP1 species encoded by SA11 isolates. The NSP1(C19) antiserum was made by using a peptide corresponding to the C-terminal 19 residues of NSP1. Residue 36 of NSP1 is Ala for SA11-4F but Glu for SA11-30-19. The NSP1 National Center for Biotechnology Information protein database accession numbers are AAK14071 (SA11-4F), AAK14072 (SA11-5S), AAK14069 (SA11-30-19), and AAK14070 (SA11-30-1A).
Fig. 3.
Fig. 3.
IRF3 levels in infected cells. (A) Lysates were prepared at 3-h intervals from Caco-2 cells infected with SA11-4F or SA11-5S and assayed for IRF3, full-length NSP1, VP6, and actin by Western blot analysis. The NSP1(C19) antiserum does not react with the C-truncated NSP1 species of SA11-5S and SA11-30-19. Intensities (percent) of IRF3 bands were determined with a PhosphorImager and normalized to 100% for IRF3 from mock-infected cells. (B) Lysates were prepared at 10 h after infection from FRhL2 cells that were mock-infected or infected with SA11-4F or SA11-5S. Lysates were assayed for IRF3, VP6, and proliferating cell nuclear antigen (PCNA) by Western blot analysis. (C) Lysates were prepared at 8 h after infection from MA104 cells infected at a moi of 20 with SA11-4F or SA11-5S and maintained in 35S-labeled amino acids beginning at 3 h after infection (18). Radiolabeled proteins in lysates were detected by SDS/PAGE and autoradiography (18). Positions of wtNSP1 and NSP1ΔC17 are indicated with dots.
Fig. 4.
Fig. 4.
Impact of viral infection on IFN-pathway activation. FRhL2 cells were transfected with p55C1BLuc, a plasmid containing an IRF3-activated IFN-β promoter element that drives luciferase expression. The cells were mock-infected or infected with the indicated virus, and, at 10 h after infection, cellular lysates were assayed for luciferase activity. The values are reported as fold increase in luciferase activity relative to mock-infected cells.
Fig. 5.
Fig. 5.
Localization of EGFP-IRF3 in rotavirus-infected cells. FRhL2 cells were transfected with the plasmid pCI-EGFP-IRF3, and, at 6 h after transfection, the cells were infected with the indicated virus. At 10 h after infection, EGFP-IRF3 (green) and the DAPI-nuclear (red) signals were detected by confocal immunofluorescence microscopy.
Fig. 6.
Fig. 6.
Levels of dimerized IRF3 in rotavirus-infected cells. Lysates prepared from infected Caco-2 cells were electrophoretically resolved under nondenaturing or denaturing conditions. Western blot analysis was used to locate monomer and dimer forms of IRF3 in the nondenaturing gel and IRF3, wtNSP1, and proliferating cell nuclear antigen (PCNA) in the denaturing gel.
Fig. 7.
Fig. 7.
Effect of NSP1 on EGFP-IRF3 levels. Equivalent amounts of pEGFP or pEGFP-IRF3 were cotransfected with pCI, pCI-NSP1, pCI-NSP1ΔC17, or pCI-NSP1ΔC71 into 293T cells to drive the expression of either EGFP or EGFP-IRF3 alone or together with wtNSP1 or NSP1ΔC proteins. (A) Epifluorescence microscopy (×10) was used to analyze the EGFP signal (green). (B) Flow cytometry analysis was used to calculate percentage of total cells that were fluorescent. The data are represented in density plot graphics where the upper left quadrant corresponds to nonfluorescent cells and the upper right quadrant corresponds to fluorescent cells. The percentage of cells in each group is given in the corresponding quadrant.
Fig. 8.
Fig. 8.
Reduction in IRF3 degradation by a proteasome inhibitor. Appropriate plasmids were transfected into 293T cells to drive the expression of EGFP-IRF3 alone or together with wtNSP1. The transfected cells or mock-transfected cells were then incubated with media containing 2.5 μM protease inhibitor MG132 dissolved in DMSO or DMSO alone. After 16 h, the percentage of luminescent cells in the population was determined by flow cytometry.
Fig. 9.
Fig. 9.
Impact of NSP1 knockdown on plaque phenotype. (A) MA104 cells were transfected with an siRNA specific to the gene encoding NSP1 (g5E) or with an Ir siRNA. Subsequently, the cells were infected with 50 plaque-forming units of SA11-4F per well. (B) Plaques formed by plating SA11-4F and SA11-5S on MA104 cells.

Similar articles

Cited by

References

    1. Lin, R., Heylbroeck, C., Pitha, P. M. & Hiscott, J. (1998) Mol. Cell. Biol. 18, 2986–2996. - PMC - PubMed
    1. Iwamura, T., Yoneyama, M., Yamaguchi, K., Suhara, W., Mori, W., Shiota, K., Okabe, Y., Namiki, H. & Fujita, T. (2001) Genes Cells 6, 375–388. - PubMed
    1. tenOever, B. R., Servant, M. J., Grandvaux, N., Lin, R. & Hiscott, J. (2002) J. Virol. 76, 3659–3669. - PMC - PubMed
    1. Hiscott, J., Pitha, P., Genin, P., Nguyen, H., Heylbroeck, C., Mamane, Y., Algarte, M. & Lin, R. (1999) J. Interf. Cytok. Res. 19, 1–13. - PubMed
    1. Sharma, S., tenOever, B. R., Grandvaux, N., Zhou, G. P., Lin, R. & Hiscott, J. (2003) Science 300, 1148–1151. - PubMed

MeSH terms