. 2005 Mar 1;19(5):570-82.
doi: 10.1101/gad.305405.

Members of the heat-shock protein 70 family promote cancer cell growth by distinct mechanisms

Affiliations

Members of the heat-shock protein 70 family promote cancer cell growth by distinct mechanisms

Mikkel Rohde et al. Genes Dev. .

Erratum in

Abstract

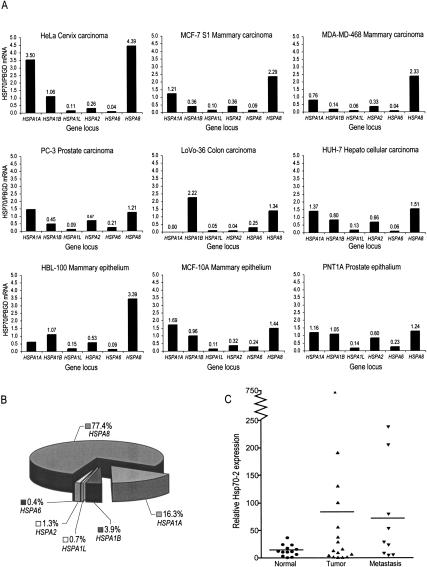
Whereas the stress-inducible heat-shock protein 70 (Hsp70) has gained plenty of attention as a putative target for tumor therapy, little is known about the role of other Hsp70 proteins in cancer. Here we present the first thorough analysis of the expression and function of the cytosolic Hsp70 proteins in human cancer cells and identify Hsp70-2, a protein essential for spermatogenesis, as an important regulator of cancer cell growth. Targeted knock-down of the individual family members by RNA interference revealed that both Hsp70 and Hsp70-2 were required for cancer cell growth, whereas the survival of tumorigenic as well as nontumorigenic cells depended on Hsc70. Cancer cells depleted for Hsp70 and Hsp70-2 displayed strikingly different morphologies (detached and round vs. flat senescent-like), cell cycle distributions (G2/M vs. G1 arrest) and gene expression profiles. Only Hsp70-2 depletion induced the expression of macrophage inhibitory cytokine-1 that was identified as a target of P53 tumor-suppressor protein and a mediator of the G1 arrest and the senescent phenotype. Importantly, concomitant depletion of Hsp70 and Hsp70-2 had a synergistic antiproliferative effect on cancer cells. Thus, highly homologous Hsp70 proteins bring about nonoverlapping functions essential for cell growth and survival.


Figures

Figure 1.
Figure 1.
Hsp70-2 is expressed in various cell lines and in primary and metastatic breast cancer tissue. (A) Expression of the genes encoded by HSPA1A, HSPA1B, HSPA1L, HSPA2, HSPA6, and HSPA8 gene loci was monitored in the indicated cell lines by RT-PCR, and their expression levels are expressed relative to the PBDG housekeeping gene. The results of one representative experiment out of a minimum of three independent measurements are shown. (B) The relative amounts of different cytosolic Hsp70 mRNAs in HeLa cells as determined by Affymetrix GeneChip array. (C) Hsp70-2 mRNA expression levels in human mammary biopsies originating from normal, primary tumor, or metastatic tumor samples were determined by real-time RT-PCR. Each dot represents an independent tissue sample, where Hsp70-2 levels are depicted relative to PBGD levels. The horizontal lines represent mean values.
Figure 2.
Figure 2.
Hsp70 and Hsp70-2 are specifically required for the growth of cancer cells.(A) Hsp70, Hsp70-2, Hsc70, and GAPDH protein levels in indicated cell lines were determined by immunoblotting 72 h after the transfection with a control siRNA (C) or siRNA targeting Hsp70 (A1), Hsp70-2 (A2.1, A2.2 and A2.3), Hsp70-6 (A6), or Hsc70 (A8). The asterisk () indicates the position of an unspecific protein detected by the Hsp70-2 antiserum. (B) Hsp70-6 mRNA levels in HeLa cells treated with oligofectamine alone (O) or transfected with a control siRNA (C) or an siRNA targeting Hsp70-6 (A6) were determined by RT-PCR. When indicated (HS), cells were heated at 45°C for 30 min, 2 h before harvesting. PCR reactions with no DNA (neg.) and genomic DNA (pos.) are shown as controls. (C) HeLa cells were transfected with indicated siRNAs as in A and photographed in the phase contrast microscope 72 h later. (D) Indicated cell lines were transfected with siRNAs as in A and analyzed for the metabolic activity by MTT assay 72 h after the transfection. The data are presented as percentage of cell density in cultures treated with oligofectamine alone (O), and averages ± SD of a triplicate experiment are shown. The experiments were performed from three to 10 times with the same results.
Figure 3.
Figure 3.
Depletion of Hsp70 and Hsp70-2 induces G2/M and G1 arrest, respectively. HeLa cells transfected with the indicated siRNAs were analyzed for the DNA content by flow cytometry 72 h after transfection. Cells were treated with nocodazole (Noco) or diluent (Untr) for 16 h before the harvest. The positions of the G1 (2N) and G2/M (4N) peaks are marked. The experiment was performed three times with the same results.
Figure 4.
Figure 4.
Depletion of Hsp70-2 induces MIC-1 and p21 expression in cancer cells. (A) Tumorigenic (HeLa and MCF-7) and nontumorigenic (PNT1A and HBL-100) cells were analyzed by RT-PCR for the expression of Hsp70-2, MIC-1, and p21CIP (represented by the upper bands in each gel) 72 h after transfection with oligofectamine alone (O), mismatch siRNA (C), or Hsp70-2 siRNA (A2.2). The lower bands represent the internal PBGD control. (B) HeLa cells were cotransfected with pX-CD20 together with an siRNA refractory mutant of Hsp70-2 (70-2) or control plasmid (Mock). Transfected cells were enriched 24 h later using anti-CD20-coated magnetic beads and subsequently transfected with a mismatch (C) or Hsp70-2 (A2.2) siRNA. After 72 h, cells were monitored for the expression of Hsp70-2 (the asterisk indicates the position of an unspecific protein detected by the Hsp70-2 antibody), MIC-1 and GAPDH by immunoblot analysis, and the surviving cells were counted. The number of surviving cells after A2.2 siRNA treatment is presented as a percentage of surviving control siRNA-treated cells, and averages ± SD of a triplicate experiment are shown. The experiments were performed at least three times with the same results.
Figure 5.
Figure 5.
Codepletion of MIC-1 alleviates the growth arrest induced by Hsp70-2 depletion. (A) HeLa cells were transfected with oligofectamine alone (O), or with 50 nM mismatch (C), Hsp70 (A1), or Hsp70-2 (A2.1 and A2.2) siRNA. When indicated, cells were cotransfected with increasing concentrations (10 nM and 20 nM) of either mismatch (C) or MIC-1 siRNA. Hsp70-2 and MIC-1 protein levels were analyzed by immunoblotting 72 h after the transfection. The asterisk indicates the position of an unspecific protein detected by the Hsp70-2 antibody. (B,C) HeLa cells were transfected with 50 nM mismatch siRNA (C) or 50 nM A2.2 siRNA alone or together with 10 nM MIC-1 or mismatch (C) siRNA. The DNA content (B) and the morphology (C) of the cells were analyzed 72 h after the transfection by flow cytometry and phase contrast microscopy, respectively. The percent increase of cells in G1 as compared to control transfected cells is depicted in B. The values present averages ± SD of a triplicate experiment. The experiments were performed at least three times with the same results.
Figure 6.
Figure 6.
Depletion of Hsp70-2 activates P53 that is involved in the induction of MIC-1. (A) HeLa cells were transfected with the indicated siRNAs, and the expression of the indicated proteins was monitored by immunoblotting 72 h later. The specific down-regulation of Hsp70t by the A1L siRNA was confirmed by RT-PCR (data not shown). (B) HeLa cells were transfected with the indicated siRNAs. The transcriptional activity of P53 was monitored 48 h later by a luciferase reporter assay and is presented relative to the activity in cells treated with oligofectamine alone (O). The data represent mean values of two duplicate experiments. (C) HeLa cells were transfected with 5 nM control siRNA (C) or decreasing concentrations of siRNAs targeting Hsp70-2 (A2.1 and A2.2). The expression of the indicated proteins was monitored by immunoblotting 72 h later. (D) HeLa cells were transfected either with 50 nM A2.2 alone or in combination with 10 nM of siRNAs against MIC-1, P53, or a control siRNA (C). The levels of the indicated proteins was monitored by immunoblotting 72 h after the transfection. The asterisk indicates the position of an unspecific protein detected by the Hsp70-2 antibody.
Figure 7.
Figure 7.
Concomitant down-regulation of Hsp70 and Hsp70-2 induce massive cell death. (A) HeLa cells were infected with either Ad.β-gal or Ad.asHsp70, and Hsp70-2 protein levels were determined by immunoblotting 48 and 72 h later. (B) Cells were left untreated (C) or infected as in A (as, Ad.asHsp70), and the expression of MIC-1 and an internal control (PDGD) was monitored by RT-PCR. (C) Hsp70, Hsp70-2, and GAPDH protein levels in HeLa cells were determined by immunoblotting 72 h after transfection with oligofectAmine alone (O), or with a control siRNA (C), siRNA targeting Hsp70-6 (A6), or siRNA targeting both Hsp70 and Hsp70-2 (A2.4). The asterisk () indicates the position of an unspecific protein detected by the Hsp70-2 antiserum. (D,E) HeLa cells were transfected with indicated siRNAs and analyzed for the metabolic activity by MTT assay (D) or photographed in a phase contrast microscope (E) 72 h after the transfection. (D) The data are presented as percent of cells treated with oligofectamine alone, and averages ± SD of a triplicate experiment are shown. All experiments were performed at least three times with the same results.

References

    1. Albertoni M., Shaw, P.H., Nozaki, M., Godard, S., Tenan, M., Hamou, M.F., Fairlie, D.W., Breit, S.N., Paralkar, V.M., de Tribolet, N., et al. 2002. Anoxia induces macrophage inhibitory cytokine-1 (MIC-1) in glioblastoma cells independently of p53 and HIF-1. Oncogene 21: 4212-4219. - PubMed
    1. Baek S.J., Kim, K.S., Nixon, J.B., Wilson, L.C., and Eling, T.E. 2001. Cyclooxygenase inhibitors regulate the expression of a TGF-β superfamily member that has proapoptotic and anti-tumorigenic activities. Mol. Pharmacol. 59: 901-908. - PubMed
    1. Bootcov M.R., Bauskin, A.R., Valenzuela, S.M., Moore, A.G., Bansal, M., He, X.Y., Zhang, H.P., Donnellan, M., Mahler, S., Pryor, K., et al. 1997. MIC-1, a novel macrophage inhibitory cytokine, is a divergent member of the TGF-β superfamily. Proc. Natl. Acad. Sci. 94: 11514-11519. - PMC - PubMed
    1. Bottner M., Suter-Crazzolara, C., Schober, A., and Unsicker, K. 1999. Expression of a novel member of the TGF-β superfamily, growth/differentiation factor-15/macrophage-inhibiting cytokine-1 (GDF-15/MIC-1) in adult rat tissues. Cell Tissue Res. 297: 103-110. - PubMed
    1. Buckhaults P., Rago, C., St Croix, B., Romans, K.E., Saha, S., Zhang, L., Vogelstein, B., and Kinzler, K.W. 2001. Secreted and cell surface genes expressed in benign and malignant colorectal tumors. Cancer Res. 61: 6996-7001. - PubMed

Publication types

MeSH terms