

Oxidative stress in transgenic mice with oligodendroglial alpha-synuclein overexpression replicates the characteristic neuropathology of multiple system atrophy
- PMID: 15743798
- PMCID: PMC1602361
- DOI: 10.1016/s0002-9440(10)62307-3
Oxidative stress in transgenic mice with oligodendroglial alpha-synuclein overexpression replicates the characteristic neuropathology of multiple system atrophy
Abstract
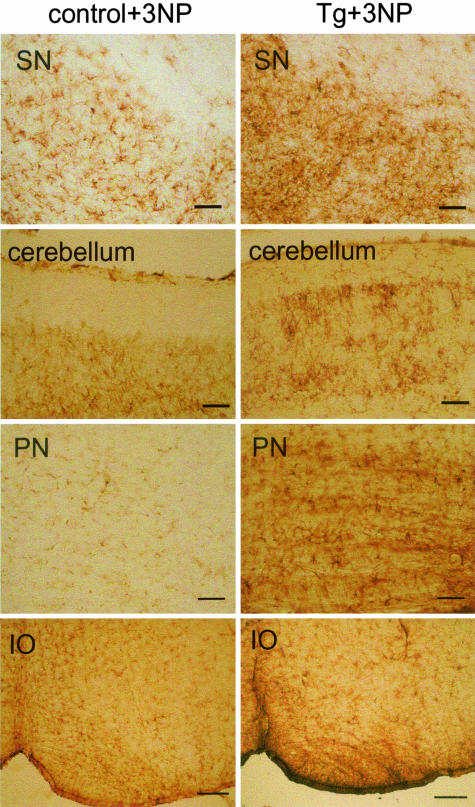
Multiple system atrophy (MSA) is a progressive neurodegenerative disorder characterized by parkinsonism unresponsive to dopaminergic therapy, cerebellar ataxia, and dysautonomia. Neuropathology shows a characteristic neuronal multisystem degeneration that is associated with widespread oligodendroglial alpha-synuclein (alpha-SYN) inclusions. Presently no animal model completely replicates the specific neuropathology of MSA. Here we investigated the behavioral and pathological features resulting from oligodendroglial alpha-SYN overexpression in transgenic mice exposed to mitochondrial inhibition by 3-nitropropionic acid. In transgenic mice 3-nitropropionic acid induced or augmented motor deficits that were associated with MSA-like pathology including striatonigral degeneration and olivopontocerebellar atrophy. Widespread astrogliosis and microglial activation were also observed in the presence of alpha-SYN in oligodendrocytes. Our results indicate that combined mitochondrial inhibition and overexpression of oligodendroglial alpha-SYN generates a novel model of MSA that may be useful for evaluating both pathogenesis and treatment strategies.
Figures


Similar articles
-
Progressive striatonigral degeneration in a transgenic mouse model of multiple system atrophy: translational implications for interventional therapies.Acta Neuropathol Commun. 2018 Jan 3;6(1):2. doi: 10.1186/s40478-017-0504-y. Acta Neuropathol Commun. 2018. PMID: 29298733 Free PMC article.
-
Targeted overexpression of human alpha-synuclein in oligodendroglia induces lesions linked to MSA-like progressive autonomic failure.Exp Neurol. 2010 Aug;224(2):459-64. doi: 10.1016/j.expneurol.2010.05.008. Epub 2010 May 21. Exp Neurol. 2010. PMID: 20493840 Free PMC article.
-
Failure of Neuroprotection Despite Microglial Suppression by Delayed-Start Myeloperoxidase Inhibition in a Model of Advanced Multiple System Atrophy: Clinical Implications.Neurotox Res. 2015 Oct;28(3):185-94. doi: 10.1007/s12640-015-9547-7. Epub 2015 Jul 21. Neurotox Res. 2015. PMID: 26194617 Free PMC article.
-
Neuropathology of multiple system atrophy: new thoughts about pathogenesis.Mov Disord. 2014 Dec;29(14):1720-41. doi: 10.1002/mds.26052. Epub 2014 Oct 9. Mov Disord. 2014. PMID: 25297524 Review.
-
A Mouse Model of Multiple System Atrophy: Bench to Bedside.Neurotherapeutics. 2023 Jan;20(1):117-126. doi: 10.1007/s13311-022-01287-8. Epub 2022 Aug 22. Neurotherapeutics. 2023. PMID: 35995919 Free PMC article. Review.
Cited by
-
FAS-dependent cell death in α-synuclein transgenic oligodendrocyte models of multiple system atrophy.PLoS One. 2013;8(1):e55243. doi: 10.1371/journal.pone.0055243. Epub 2013 Jan 25. PLoS One. 2013. PMID: 23372841 Free PMC article.
-
Management of multiple system atrophy: state of the art.J Neural Transm (Vienna). 2005 Dec;112(12):1695-704. doi: 10.1007/s00702-005-0379-0. J Neural Transm (Vienna). 2005. PMID: 16284911 Review.
-
Impaired skeletal muscle health in Parkinsonian syndromes: clinical implications, mechanisms and potential treatments.J Cachexia Sarcopenia Muscle. 2023 Oct;14(5):1987-2002. doi: 10.1002/jcsm.13312. Epub 2023 Aug 13. J Cachexia Sarcopenia Muscle. 2023. PMID: 37574254 Free PMC article. Review.
-
Modulation of alpha-synuclein expression in transgenic animals for modelling synucleinopathies--is the juice worth the squeeze?Neurotox Res. 2008 Dec;14(4):329-41. doi: 10.1007/BF03033857. Neurotox Res. 2008. PMID: 19073436 Free PMC article. Review.
-
Insulin resistance and exendin-4 treatment for multiple system atrophy.Brain. 2017 May 1;140(5):1420-1436. doi: 10.1093/brain/awx044. Brain. 2017. PMID: 28334990 Free PMC article.
References
-
- Gilman S, Low PA, Quinn N, Albanese A, Ben-Shlomo Y, Fowler CJ, Kaufmann H, Klockgether T, Lang AE, Lantos PL, Litvan I, Mathias CJ, Oliver E, Robertson D, Schatz I, Wenning GK. Consensus statement on the diagnosis of multiple system atrophy. J Neurol Sci. 1999;163:94–98. - PubMed
-
- Wenning GK, Colosimo C, Geser F, Poewe W. Multiple system atrophy. Lancet Neurol. 2004;3:93–103. - PubMed
-
- Daniel S. Autonomic failure. Bannister R, Mathias CJ, editors. Oxford: University Press; The Neuropathology and Neurochemistry of Multiple System Atrophy. 1999:pp 321–328.
-
- Ishizawa K, Komori T, Sasaki S, Arai N, Mizutani T, Hirose T. Microglial activation parallels system degeneration in multiple system atrophy. J Neuropathol Exp Neurol. 2004;63:43–52. - PubMed
-
- Wenning GK, Seppi K, Tison F, Jellinger K. A novel grading scale for striatonigral degeneration (multiple system atrophy). J Neural Transm. 2002;109:307–320. - PubMed
Publication types
MeSH terms
Substances
LinkOut - more resources
Full Text Sources
Other Literature Sources
Molecular Biology Databases
Miscellaneous
