. 2005 Mar;25(6):2085-94.
doi: 10.1128/MCB.25.6.2085-2094.2005.

High-resolution genome-wide mapping of transposon integration in mammals

Affiliations

High-resolution genome-wide mapping of transposon integration in mammals

Stephen R Yant et al. Mol Cell Biol. 2005 Mar.

Abstract

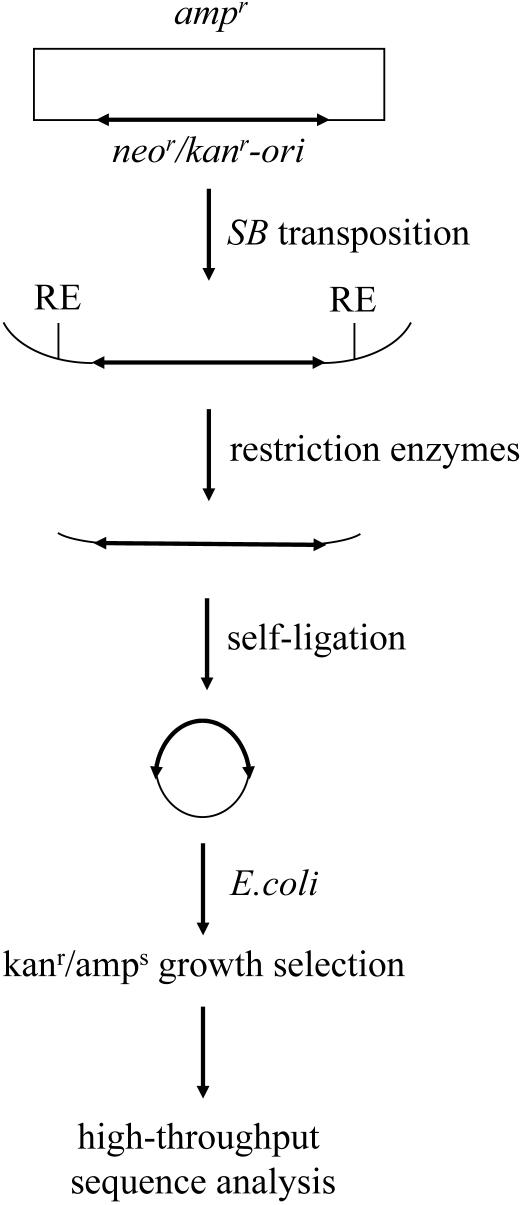
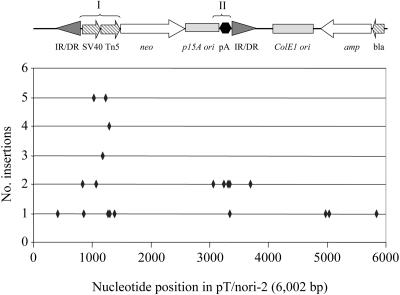
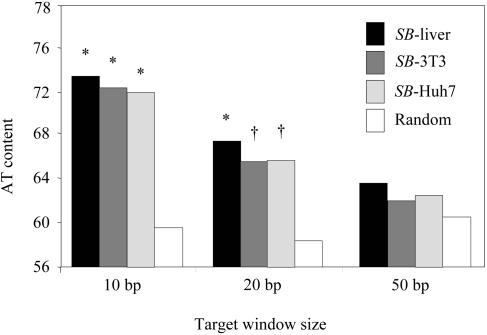
The Sleeping Beauty (SB) transposon is an emerging tool for transgenesis, gene discovery, and therapeutic gene delivery in mammals. Here we studied 1,336 SB insertions in primary and cultured mammalian cells in order to better understand its target site preferences. We report that, although widely distributed, SB integration recurrently targets certain genomic regions and shows a small but significant bias toward genes and their upstream regulatory sequences. Compared to those of most integrating viruses, however, the regional preferences associated with SB-mediated integration were much less pronounced and were not significantly influenced by transcriptional activity. Insertions were also distinctly nonrandom with respect to intergenic sequences, including a strong bias toward microsatellite repeats, which are predominantly enriched in noncoding DNA. Although we detected a consensus sequence consistent with a twofold dyad symmetry at the target site, the most widely used sites did not match this consensus. In conjunction with an observed SB integration preference for bent DNA, these results suggest that physical properties may be the major determining factor in SB target site selection. These findings provide basic insights into the transposition process and reveal important distinctions between transposon- and virus-based integrating vectors.


Figures

FIG. 1.
FIG. 1.
Plasmid rescue strategy to isolate transposon insertion sites. SB integration was initiated by cotransfecting different mammalian cells with plasmids encoding the SB transposase and an SB transposon (thick arrow) containing a bacterial origin of replication (ori) and sequences to permit Neor and Kanr growth. In some cases, transfected cells were selected in the antibiotic G418 for stable transposon expression. The genomic sequences flanking integrated elements were recovered by cutting genomic DNA with three compatible restriction enzymes (RE) to minimize the potential for restriction site bias, followed by religation with T4 ligase and transformation into E. coli. Bacteria were selected for Kanr Amps growth and then amplified by using a 96-well format to isolate plasmid DNA. The DNA flanking the recovered transposons was determined by sequence analysis using primers that anneal to the transposon ends and was mapped to its respective genome by using the BLAT program.
FIG. 2.
FIG. 2.
Genome-wide distribution of SB integrations. (A) Distribution of integration events at the chromosome level. Only insertions isolated from unselected mouse liver tissue (n = 590) were analyzed, because these cells contain a normal karyotype. The distribution of SB integration events was compared to that of 10,000 computer-simulated random integrations to test for statistical significance. (B) SB insertion site mapping in the mouse genome. The relative positions of 970 total independent integration sites for SB (liver plus NIH 3T3 cells) within the mouse genome are shown.
FIG. 3.
FIG. 3.
Distribution of SB transposon insertions in the pT/nori-2 target plasmid. The number of insertions per TA dinucleotide is shown relative to the nucleotide map of the target plasmid. Locations of the functional domains of the plasmid, as well as the two preferred regions (I and II), are shown. Arrows indicate promoters and genes, shaded triangles represent transposon inverted repeats, and the polyadenylation signal region is shown in black.
FIG. 4.
FIG. 4.
Genomic AT contents of SB integrations in three different cell types. The total AT contents of SB insertion sites were analyzed by using variable window sizes and were compared to those of 10,000 random integrations. Significant differences were determined by a χ2 test. *, P < 0.0001; †, P < 0.02.

Similar articles

Cited by

References

    1. Balciunas, D., A. E. Davidson, S. Sivasubbu, S. B. Hermanson, Z. Welle, and S. C. Ekker. 2004. Enhancer trapping in zebrafish using the Sleeping Beauty transposon. BMC Genomics 5:62. - PMC - PubMed
    1. Belur, L. R., J. L. Frandsen, A. J. Dupuy, D. H. Ingbar, D. A. Largaespada, P. B. Hackett, and R. Scott McIvor. 2003. Gene insertion and long-term expression in lung mediated by the Sleeping Beauty transposon system. Mol. Ther. 8:501-507. - PubMed
    1. Bushman, F. D. 2003. Targeting survival: integration site selection by retroviruses and LTR-retrotransposons. Cell 115:135-138. - PubMed
    1. Bushman, F. D. 1994. Tethering human immunodeficiency virus 1 integrase to a DNA site directs integration to nearby sequences. Proc. Natl. Acad. Sci. USA 91:9233-9237. - PMC - PubMed
    1. Carlson, C. M., A. J. Dupuy, S. Fritz, K. J. Roberg-Perez, C. F. Fletcher, and D. A. Largaespada. 2003. Transposon mutagenesis of the mouse germline. Genetics 165:243-256. - PMC - PubMed

Publication types

Substances

LinkOut - more resources