. 2005 Mar;25(6):2227-41.
doi: 10.1128/MCB.25.6.2227-2241.2005.

Removal of C-terminal SRC kinase from the immune synapse by a new binding protein

Affiliations

Removal of C-terminal SRC kinase from the immune synapse by a new binding protein

Souad Rahmouni et al. Mol Cell Biol. 2005 Mar.

Abstract

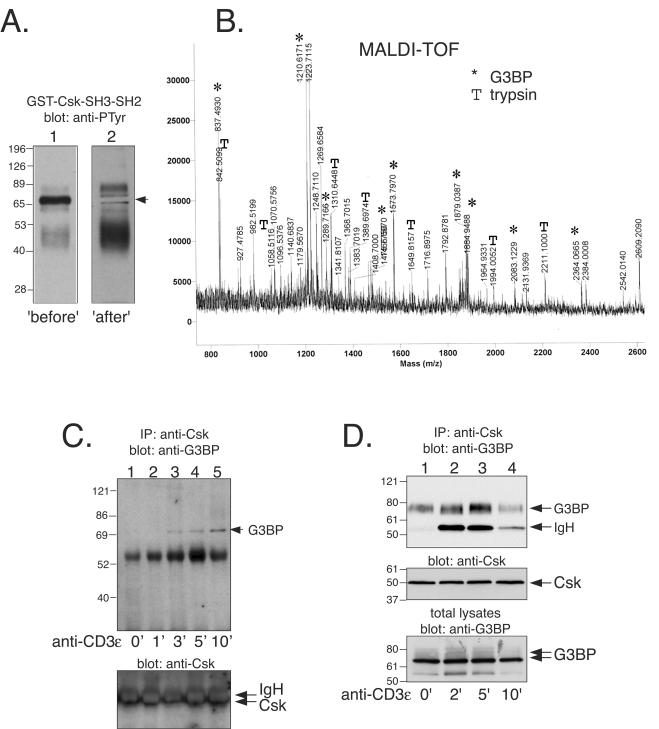
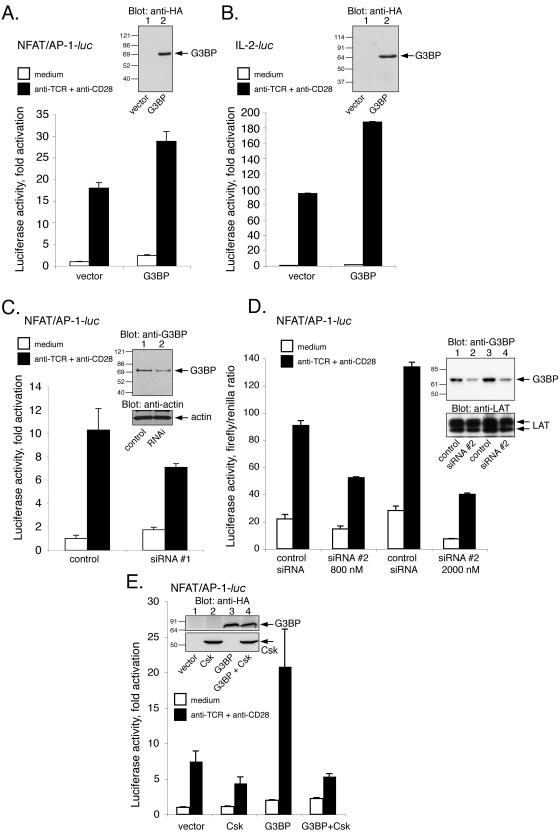
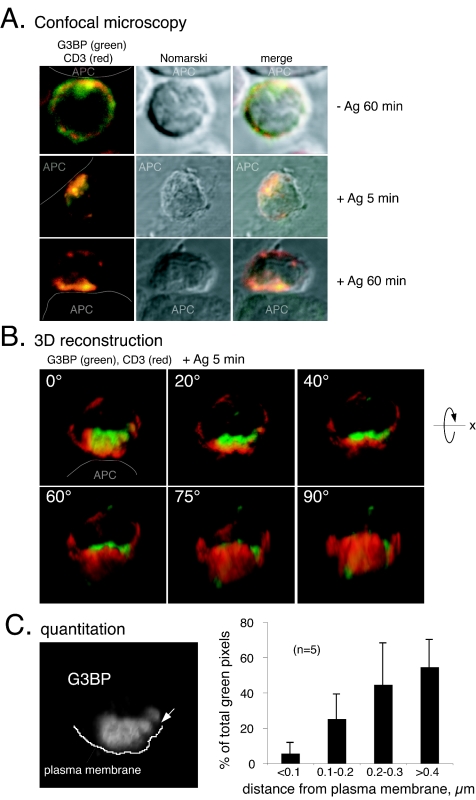
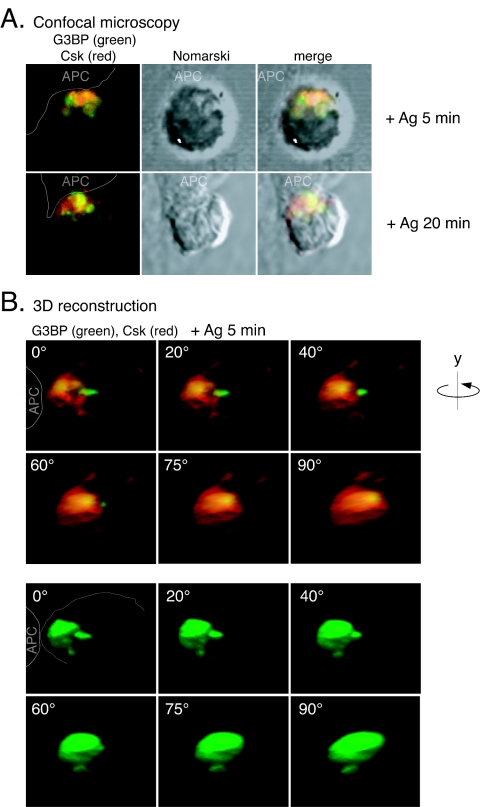
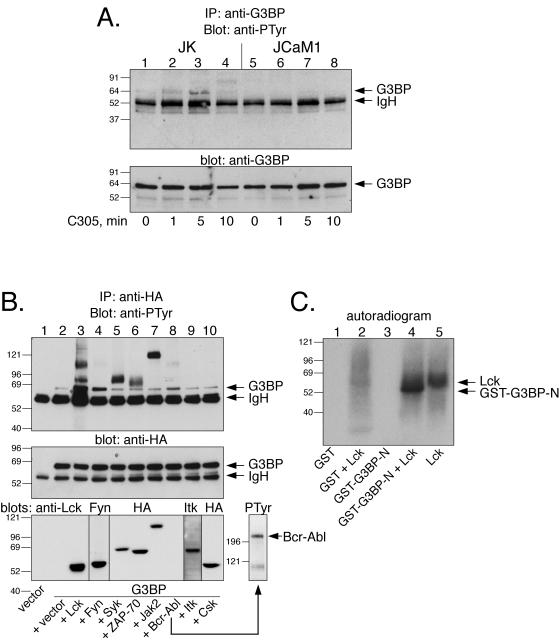
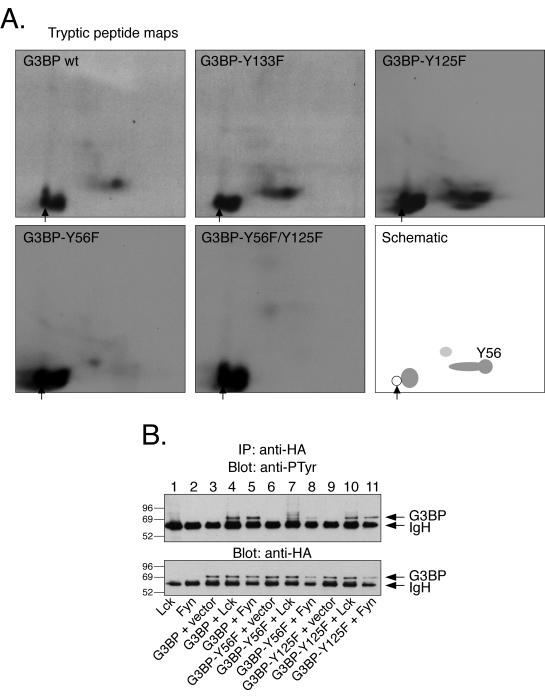
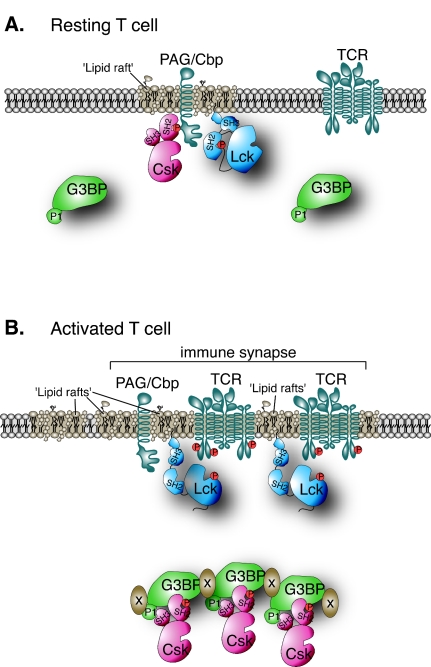
The Csk tyrosine kinase negatively regulates the Src family kinases Lck and Fyn in T cells. Engagement of the T-cell antigen receptor results in a removal of Csk from the lipid raft-associated transmembrane protein PAG/Cbp. Instead, Csk becomes associated with an approximately 72-kDa tyrosine-phosphorylated protein, which we identify here as G3BP, a phosphoprotein reported to bind the SH3 domain of Ras GTPase-activating protein. G3BP reduced the ability of Csk to phosphorylate Lck at Y505 by decreasing the amount of Csk in lipid rafts. As a consequence, G3BP augmented T-cell activation as measured by interleukin-2 gene activation. Conversely, elimination of endogenous G3BP by RNA interference increased Lck Y505 phosphorylation and reduced TCR signaling. In antigen-specific T cells, endogenous G3BP moved into a intracellular location adjacent to the immune synapse, but deeper inside the cell, upon antigen recognition. Csk colocalization with G3BP occurred in this "parasynaptic" location. We conclude that G3BP is a new player in T-cell-antigen receptor signaling and acts to reduce the amount of Csk in the immune synapse.


Figures

FIG. 1.
FIG. 1.
Identification of the 72-kDa Csk-associated phosphoprotein as G3BP. (A) Anti-PTyr immunoblots of material precipitated by a GST-Csk-SH3-SH2 protein (“before”). The second lane represents a parallel second sample, from which the region corresponding to the 72-kDa band was cut out with the help of the first lane, and the remaining filter was then blotted with anti-PTyr to verify that the correct band had been excised (“after”). The second filter is darker because it contained four times more material. (B) Mass spectrogram of the trypsin digest of the 72-kDa protein band from panel A. Peptide peaks derived from G3BP (✽) and trypsin (T) are indicated. (C) Anti-G3BP immunoblot of anti-Csk immunoprecipitates from untreated Jurkat T cells (lane 1) and from cells treated with OKT3 for 1 min (lane 2), 3 min (lane 3), 5 min (lane 4), or 10 min (lane 5). (D) Anti-G3BP immunoblot of anti-Csk immunoprecipitates from untreated normal human T lymphocytes (lane 1) and from cells treated with OKT3 and F(ab′)2 fragments for 2 min (lane 2), 5 min (lane 3), or 10 min (lane 4). The immunoglobulin heavy chain seen in lanes 2 to 4 is from OKT3.
FIG. 2.
FIG. 2.
G3BP decreases Csk function and sequesters Csk away from lipid rafts. (A) The top panel shows an anti-Lck-phospho-Y505 immunoblot of lysates from Jurkat T cells transfected with GFP (lane 1) or GFP-G3BP (lane 2) and sorted for green fluorescence. The middle panel shows anti-Lck immunoblotting of the same filter to verify equal loading. The bottom panel shows anti-G3BP immunoblots of the same lysates. Note that endogenous G3BP is present in both lanes, but the transfected GFP-G3BP is only seen in lane 2. (B) The upper panel shows anti-Csk immunoblot of C305-treated (lanes 1 to 3) or resting (lanes 4 to 6) control Jurkat T cells fractionated into buoyant detergent-insoluble (lipid rafts), detergent-soluble fractions (soluble), or detergent-free soluble (cytosol) fractions. The lower panel shows anti-Csk immunoblot of a similarly fractionation of G3BP-transfected cells. Equal amounts of protein were loaded in each lane between the upper and lower panels. (C) The top panel shows anti-G3BP immunoblots of lipid raft fractionation of resting Jurkat T cells. Lipid rafts are in fractions 1 and 2. The second to fifth panels show the same experiment with cells stimulated through the TCR for 5, 10, 30, and 60 min. The sixth and seventh panels show immunoblots with anti-PAG, anti-Lck, and anti-Csk antibodies of the same fractions as in the top panel. The seventh panel is a longer exposure (without anti-Lck) to show Csk better. The bottom panel shows an anti-LAT blot of the same fractions as a lipid raft marker. (D) The upper panel shows an anti-Lck-phospho-Y506 immunoblot of lysates from Jurkat T cells transfected with control siRNA (lane 1) or G3BP siRNA (lane 2) together with a fluorescent RNA oligonucleotide and sorted for green fluorescence. The lower panel shows anti-G3BP immunoblots of the same lysates.
FIG. 3.
FIG. 3.
Stimulatory role of G3BP in TCR signaling. (A) Luciferase activity of lysates from Jurkat T cells transfected with a luciferase reporter driven by a NFAT/AP-1 element from the 5′ IL-2 promoter alone or together with the G3BP expression plasmid. Prior to lysis, the cells were either left untreated or stimulated for 6 h with anti-TCR (C305) plus anti-CD28 MAbs, as indicated. The inset shows an anti-HA immunoblot of the same lysates. The results are given as the fold induction versus unstimulated samples with reporter alone and represent the means of triplicate determinations. Error bars show the standard deviations of the values. Very similar results were obtained in two additional independent experiments. (B) Similar assay with a luciferase reporter containing the entire 5′ IL-2 gene promoter. The results are given as the fold induction versus unstimulated samples with reporter alone and represent the means of triplicate determinations. Error bars show the standard deviations of the values. Very similar results were obtained in one additional independent experiment. (C) Luciferase activity of lysates from Jurkat T cells transfected with the same NFAT/AP-1 luciferase reporter as in panel A plus either a control RNA or the G3BP-specific RNA interference oligonucleotide (RNAi). Three days later the cells were either left untreated or stimulated for 6 h with anti-TCR (C305) plus anti-CD28 MAbs, as indicated. The results are given as the fold induction versus unstimulated samples with reporter alone and represent the means of triplicate determinations. Error bars show the standard deviations of the values. Very similar results were obtained in another independent experiment. The insert shows an anti-G3BP immunoblot of lysates of Jurkat cells transfected with fluorescein-conjugated control RNA duplex alone (control) or together with a G3BP-specific RNA duplex (RNAi) and then sorted out for green fluorescence. The lower panel is an antiactin blot to verify equal loading. (D) Same experiment as in panel C with a different G3BP-specific siRNA used at 800 nM and 2 μM. The insert is a G3BP immunoblot (upper panel) and anti-LAT blot (lower panel) as a loading control. (E) Luciferase activity of lysates from Jurkat T cells transfected with the same NFAT/AP-1 luciferase reporter as in panel A plus either Csk, G3BP, or both. The insert shows an anti-HA immunoblot of the same lysates to demonstrate the expression of Csk and G3BP. The upper half represents a longer exposure.
FIG. 4.
FIG. 4.
Parasynaptic localization of G3BP during antigen recognition. (A) Location of G3BP (green) and CD3 (red) in CD8+ OT-I T cells overlaid on control BOK cells (−Ag) or OVA-presenting SAMBOK APC (+Ag) and viewed under the confocal microscope as described in Materials and Methods. The second panel in each row is a Nomarski differential phase-contrast image of the same T-cell, and the last panel is an overlay of the two first panels. (B) Quantitation of G3BP location in relation to the plasma membrane in immune synapses. The data are given as a percentage of the total G3BP pixels within 100-nm-wide zones from the plasma membrane and represent the average ± the standard deviations from five different images, including the two three-dimensional reconstructions shown in panel B and in Fig. 5. (C) Three-dimensional reconstruction of a representative OT-I T-cell stained for G3BP (green) and CD3 (red) in contact with a SAMBOK cell (white arrow at the contact site). The reconstructed cell is gradually rotated counterclockwise around the x axis from panel to panel, so that the bottom right hand panel represents the direction from which the APC would see the T cell. Note that G3BP accumulates at the T-cell-APC contact site but remains ∼0.5 μm from the cell surface.
FIG. 5.
FIG. 5.
Parasynaptic localization of G3BP and partial colocalization with Csk during antigen recognition. (A) Location of G3BP (green) and Csk (red) in CD8+ OT-I T cells overlaid on OVA-presenting SAMBOK APC and viewed under the confocal microscope. The second panel in each row is a Nomarski differential phase-contrast image of the same T-cell, and the last panel is an overlay of the two first panels. (B) Three-dimensional reconstruction of a representative OT-I T-cell stained for G3BP (green) and Csk (red) in contact with a SAMBOK cell (white arrow at contact site). The reconstructed cell is gradually rotated counterclockwise around the y axis, so that the bottom right-hand panel represents the direction from which the APC would see the T cell. Note that G3BP accumulates at the T-cell-APC contact site but remains deeper inside the cell than Csk.
FIG. 6.
FIG. 6.
Tyrosine phosphorylation of G3BP by Src family PTKs. (A) The upper panel shows an anti-PTyr immunoblot of G3BP immunoprecipitated with the anti-G3BP MAb from Jurkat T leukemia cells (lanes 1 to 4) or the Lck-negative JCaM1 variant of Jurkat (lanes 5 to 8) stimulated with the C305 anti-TCR MAb for the indicated times. The lower panel shows equal amounts of G3BP in each lane verified by MAb anti-G3BP immunoblotting. (B) The upper panel shows an anti-PTyr immunoblot of G3BP immunoprecipitated with the anti-HA epitope tag antibody from COS cells cotransfected with the indicated kinases. The lower panel shows equal amounts of G3BP in each lane verified by anti-HA immunoblotting of the same filter. (C) Autoradiogram of GST (lanes 1 and 2) or GST-G3BP-N (lanes 3 and 4) incubated with recombinant Lck in the presence of [γ-32P]ATP for 30 min and resolved by SDS-PAGE. Lane 5 shows Lck alone.
FIG. 7.
FIG. 7.
Mapping of the major tyrosine phosphorylation site in G3BP. (A) Tryptic peptide maps of G3BP or G3BP mutants phosphorylated in vitro by recombinant Lck as in Fig. 2C. The bottom right-hand panel is a schematic view of the major peptides and the spot that contains Y56. Note that this spot is missing in the maps of the Y56F and Y56F/Y125F mutants. A sample origin is indicated by an arrow. (B) The upper panel shows an anti-PTyr immunoblot of G3BP immunoprecipitated with the anti-HA epitope tag antibody from COS cells cotransfected with G3BP mutants and Lck or Fyn, as indicated. The lower panel shows equal amounts of G3BP in each lane verified by anti-HA immunoblotting of the same filter.
FIG. 8.
FIG. 8.
Schematic model of G3BP function in T-cell activation. (A) In a resting T cell, much of G3BP is diffusely distributed throughout deeper cytosolic regions, whereas the functionally important portion of Csk is at the plasma membrane bound to PAG/Cbp in lipid rafts adjacent to the targets for Csk, Lck, and Fyn. (B) Upon activation of the T cell, some of Csk is released from PAG/Cbp and binds to G3BP, which becomes enriched in the deeper cytoplasmic regions facing the APC in the polarized T cell. Thus, the portion of Csk bound to G3BP is kept away from the plasma membrane of the immune synapse.

Similar articles

Cited by

References

    1. Alonso, A., S. Rahmouni, S. Williams, M. van Stipdonk, L. Jaroszewski, A. Godzik, R. T. Abraham, S. P. Schoenberger, and T. Mustelin. 2003. Tyrosine phosphorylation of VHR by ZAP-70. Nat. Immunol. 4:44-48. - PubMed
    1. Amrein, K., and B. M. Sefton. 1988. Mutation of a site of tyrosine phosphorylation in the lymphocyte-specific tyrosine protein kinase, p56lck, reveals its oncogenic potential in fibroblasts. Proc. Natl. Acad. Sci. USA 85:4247-4251. - PMC - PubMed
    1. Barnes, C. J., F. Li, M. Mandal, Z. Yang, A. A. Sahin, and R. Kumar. 2002. Heregulin induces expression, ATPase activity, and nuclear localization of G3BP, a Ras signaling component, in human breast tumors. Cancer Res. 62:1251-1255. - PubMed
    1. Bergman, M., T. Mustelin, C. Oetken, J. Partanen, N. A. Flint, K. E. Amrein, M. Autero, P. Burn, and K. Alitalo. 1992. The human p50csk tyrosine kinase phosphorylates Lck at Tyr-505 and downregulates its catalytic activity. EMBO J. 11:2919-2924. - PMC - PubMed
    1. Brdicka, T., D. Pavlistova, A. Leo, E. Bruyns, V. Korinek, P. Angelisova, J. Scherer, A. Shevchenko, I. Hilgert, J. Cerny, K. Drbal, Y. Kuramitsu, B. Kornacker, V. Horejsi, and B. Schraven. 2000. Phosphoprotein associated with glycosphingolipid-enriched microdomains (PAG), a novel ubiquitously expressed transmembrane adapter protein, binds the protein tyrosine kinase csk and is involved in regulation of T-cell activation. J. Exp. Med. 191:1591-1604. - PMC - PubMed

Publication types

MeSH terms

Substances