. 2005 Mar;25(6):2395-405.
doi: 10.1128/MCB.25.6.2395-2405.2005.

The novel ETS factor TEL2 cooperates with Myc in B lymphomagenesis

Affiliations

The novel ETS factor TEL2 cooperates with Myc in B lymphomagenesis

Monica Cardone et al. Mol Cell Biol. 2005 Mar.

Abstract

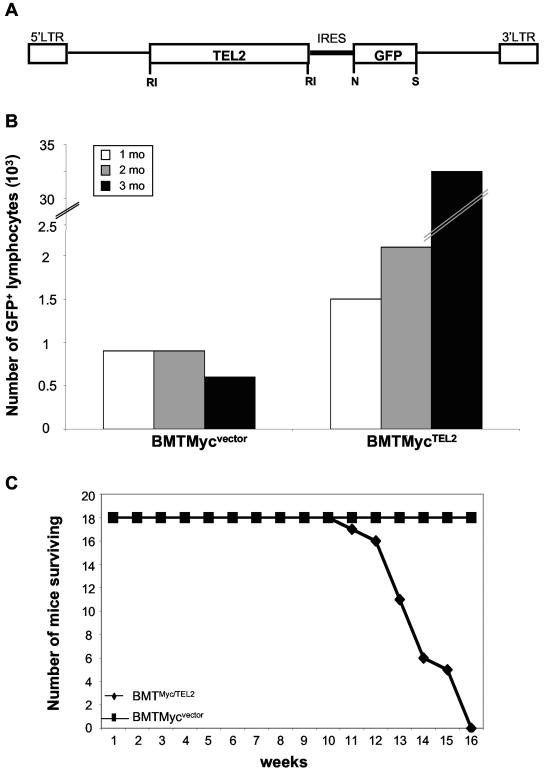
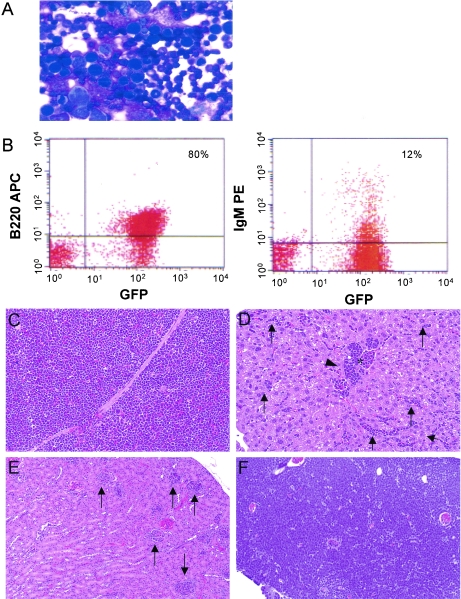
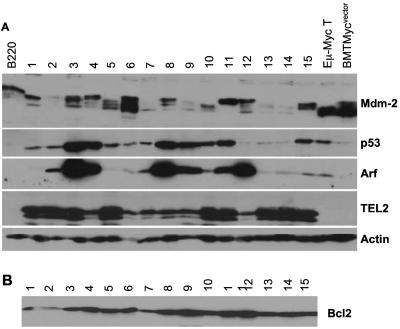
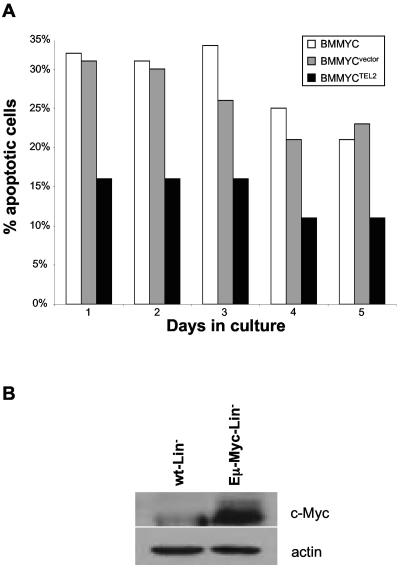
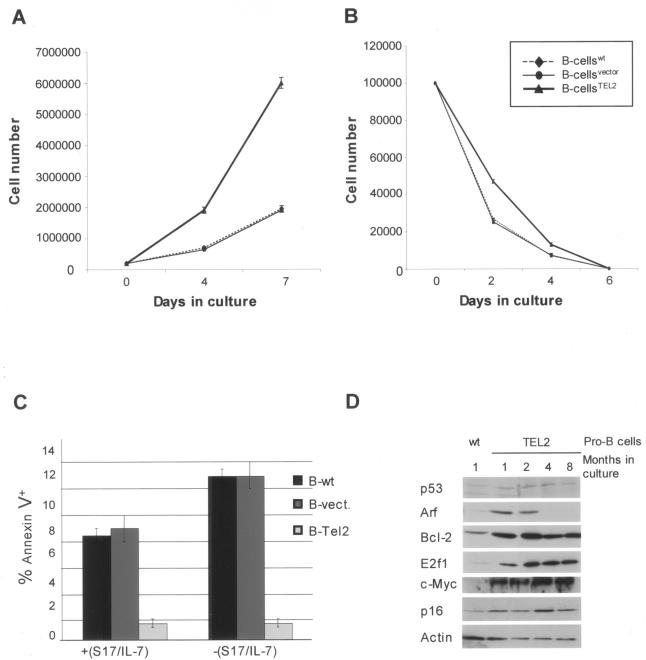
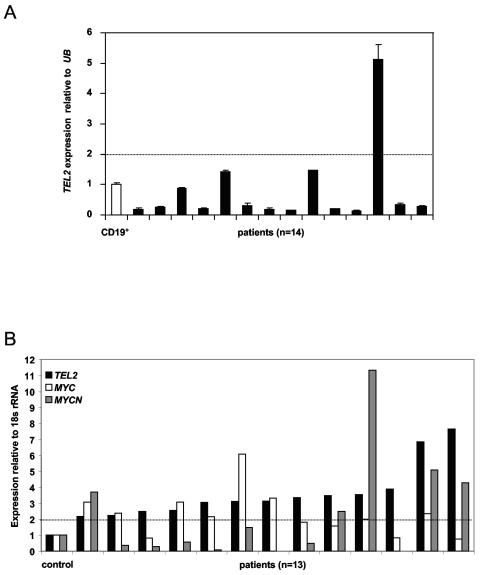
The human ETS family gene TEL2/ETV7 is highly homologous to TEL1/ETV6, a frequent target of chromosome translocations in human leukemia and specific solid tumors. Here we report that TEL2 augments the proliferation and survival of normal mouse B cells and dramatically accelerates lymphoma development in Emu-Myc transgenic mice. Nonetheless, inactivation of the p53 pathway was a hallmark of all TEL2/Emu-Myc lymphomas, indicating that TEL2 expression alone is insufficient to bypass this apoptotic checkpoint. Although TEL2 is infrequently up-regulated in human sporadic Burkitt's lymphoma, analysis of pediatric B-cell acute lymphocytic leukemia (B-ALL) samples showed increased coexpression of TEL2 and MYC and/or MYCN in over one-third of B-ALL patients. Therefore, TEL2 and MYC also appear to cooperate in provoking a cadre of human B-cell malignancies.


Figures

FIG. 1.
FIG. 1.
c-Myc and TEL2 cooperate in murine B lymphomagenesis. (A) Schematic of the MSCV-TEL2-IRES-GFP retroviral vector showing the TEL2 cDNA followed by the IRES and GFP marker gene and the 5′ and 3′ long terminal repeats (LTR). RI, EcoRI; N, NotI; S, SalI. (B) Average numbers of GFP+ lymphocytes in C57BL/6 mice transplanted with 106 Eμ-Myc/vector-transduced BMCs (48% GFP+) or with 106 Eμ-Myc/TEL2-transduced BMCs (50% GFP+). (C) Survival curve of C57BL/6 mice transplanted with 106 Eμ-Myc/vector-transduced BMCs or with 106 Eμ-Myc/TEL2-transduced BMCs. All BMTMycTEL2 mice died of B-cell lymphoma by 16 weeks posttransplantation. The cumulative data of three independent experiments are shown.
FIG. 2.
FIG. 2.
Eμ-Myc/TEL2-transplanted mice develop B220+ B-cell lymphoma. (A) Wright-Giemsa-stained peripheral blood smear showing cells with morphological features of lymphoblasts in diseased animals transplanted with Eμ-Myc/TEL2 bone marrow. Magnification, ×400. (B) Flow cytometric immunophenotyping of BMCs of a diseased BMTMycTEL2 mouse. The lineage-specific B220 antibodies were labeled with allophycocyanin (APC), and the IgM antibodies were labeled with phycoerythrin (PE). Most of the cells (80%) were B220+, and a small (10%) subpopulation was also IgM+, which is typical for B-cell lymphomas occurring in Eμ-Myc mice. Diseased BMTMycTEL2 mice were characterized by massive organ infiltration of lymphoblastic cells. Hematoxylin and eosin staining showed the following: an extensive presence of neoplastic cells in the spleen (C); neoplastic lymphocytes forming cuffs around vessels (arrowheads), expanded sinusoids (arrows), and distended pulmonary veins (*) in the liver (D); neoplastic cells in the glomerular capillaries (arrows) in the kidney (E); and extensive infiltration of lymphoblastic cells in the lymph nodes (F). Magnification, ×100 (lymph node) or ×200 (spleen, liver, and kidney).
FIG. 3.
FIG. 3.
Eμ-Myc/TEL2 tumors display a marked bias towards p53 mutations. (A) Western blots of spleen cell lysates from diseased BMTMycTEL2 mice (lanes 1 to 15) were incubated with Mdm2, p53, Arf, TEL2, and actin antibodies, indicated at the right of the panels. Controls were a 100-μg aliquot of lysate of sorted B220 normal spleen cells (B220), of a Eμ-Myc tumor cell line bearing a p53 mutation, and of a spleen of a healthy BMTMycvector-transplanted mouse euthanized 3 months after transplantation (BMTMycvector). All but three infiltrated spleen samples overexpressed mutant p53 (lanes 12 to 14). All but one lymphoma (lane 1) expressed moderate to high levels of Arf. As expected, all Eμ-Myc/TEL2 tumors expressed TEL2. Actin is shown as a loading control. (B) Western blot of the same filter with Bcl-2 antibody. All Eμ-Myc/TEL2 BMT tumors expressed elevated levels of Bcl-2, which is expressed at very low levels in sorted B220+, IgM Eμ-Myc spleen cells (; see also Fig. 6 of reference 12).
FIG. 4.
FIG. 4.
TEL2 inhibits Myc-induced apoptosis. (A) Eμ-Myc BMCs transduced with MSCV-TEL2-IRES-GFP or MSCV-IRES-GFP viruses were cultured in vitro for 5 days. At each day the percentage of cells expressing Annexin-V was determined using flow cytometry. (B) Immunoblot showing c-Myc expression in wild-type Lin-selected and Eμ-Myc Lin-selected cells to confirm c-Myc overexpression in Eμ-Myc cells. Immunoblotting against actin was used as a loading control.
FIG. 5.
FIG. 5.
TEL2 accelerates pro-B-cell proliferation and promotes pro-B-cell survival and immortalization. (A) Primary pro-B cells were transduced with MSCV-TEL2-IRES-GFP or MSCV-IRES-GFP. Sorted GFP+ cells (105) were plated onto an S17 stromal layer with IL-7 and counted after trypan blue staining to exclude dead cells from the total counts. The growth curve shows the number of cells in the different cultures at the indicated days during 1 week of culture. The average of three experiments is shown. Bars indicate the standard deviation. (B) Cells (105) were plated without S17 stromal cells and IL-7. The number of live cells at different days in the cultures was determined by counting trypan blue-negative cells at the indicated days during 1 week of culture. The average of three experiments is shown. Bars indicate the standard deviation. (C) Apoptotic indices (Annexin-V+) of wild-type pro-B cells, vector-only-expressing pro-B cells, and TEL2-expressing pro-B cells were compared after 3 weeks in culture on S17 feeder cells and IL-7 (left) by using flow cytometry. After these 3 weeks of culture, 107 cells were taken and deprived of S17 and IL-7 for 24 h and the apoptotic index was determined (right). TEL2-expressing pro-B cells are less sensitive to growth factor deprivation initially, most likely due to their increased Bcl-2 expression. The average of three experiments is shown. Bars indicate the standard deviation. (D) TEL2-expressing pro-B cells were cultured for 8 months. At 1, 2, 4, and 8 months, 107 cells were removed from the culture, lysed, and assessed for their expression of p53, Arf, Bcl-2, E2f1, c-Myc, and p16ink4a. Their expression levels were compared to levels in wild-type pro-B cells and cultured for 1 month, after which time they senesced. TEL2-expressing pro-B cells expressed high levels of Bcl-2, E2f1, and c-Myc, which would promote their growth and survival. As a result of this proliferative stress, TEL2-expressing pro-B cells show a slightly increased expression of p53 and a considerable increase in Arf expression during the first 2 months of culture. Thereafter, Arf expression was lost, indicating the emergence of immortalized cells. Also note that Arf expression was selectively silenced as p16Ink4a expression increased with time in culture.
FIG. 6.
FIG. 6.
Expression of TEL2 in BL patients and of TEL2, MYC, and MYCN in pediatric B-ALL patients. (A) TEL2 mRNA levels in 14 BL samples was determined by quantitative RT-PCR and compared with the level of TEL2 mRNA in CD19+ FACS-analyzed peripheral blood B cells of a normal donor. The relative levels of TEL2 mRNA in the different samples were determined after normalization for the amount of UB mRNA. TEL2 mRNA levels in CD19+ FACS-analyzed peripheral blood B cells are twofold lower than in control bone marrow (data not shown). One BL sample showed a fivefold-elevated level of TEL2 mRNA. The dotted line indicates the level of twofold overexpression. (B) TEL2 and MYC/MYCN mRNA levels were determined in bone marrow aspirates of 23 B-ALL patients by quantitative RT-PCR and compared to the levels in normal bone marrow (control). The level of 18S rRNA was used as internal control. Data for the 13 patients (patients 11 to 23) (see also Table S1 in the supplemental material) with TEL2 RNA levels twofold higher than that in control bone marrow are shown. The levels of MYC, MYCN, and TEL2 mRNA of all 23 patients are shown in Fig. S1 in the supplemental material. The mRNA levels of TEL2, MYC, and MYCN in bone marrow were set at 1. The dotted line indicates twofold overexpression compared to normal bone marrow. Only patients 13 and 18 failed to show combined up-regulation of TEL2 and MYC/MYCN, whereas the N-MYC level in patients 17 and 21 could not be determined due to insufficient RNA.

Similar articles

Cited by

References

    1. Adams, J. M., A. W. Harris, C. A. Pinkert, L. M. Corcoran, W. S. Alexander, S. Cory, R. D. Palmiter, and R. L. Brinster. 1985. The c-myc oncogene driven by immunoglobulin enhancers induces lymphoid malignancy in transgenic mice. Nature 318:533-538. - PubMed
    1. Alexander, W. S., J. W. Schrader, and J. M. Adams. 1987. Expression of the c-myc oncogene under control of an immunoglobulin enhancer in E mu-myc transgenic mice. Mol. Cell. Biol. 7:1436-1444. - PMC - PubMed
    1. ar-Rushdi, A., K. Nishikura, J. Erikson, R. Watt, G. Rovera, and C. M. Croce. 1983. Differential expression of the translocated and the untranslocated c-myc oncogene in Burkitt lymphoma. Science 222:390-393. - PubMed
    1. Bates, S., A. C. Phillips, P. A. Clark, F. Stott, G. Peters, R. L. Ludwig, and K. H. Vousden. 1998. p14ARF links the tumour suppressors RB and p53. Nature 395:124-125. - PubMed
    1. Baudino, T. A., K. H. Maclean, J. Brennan, E. Parganas, C. Yang, A. Aslanian, J. A. Lees, C. J. Sherr, M. F. Roussel, and J. L. Cleveland. 2003. Myc-mediated proliferation and lymphomagenesis, but not apoptosis, are compromised by E2f1 loss. Mol. Cell 11:905-914. - PubMed

Publication types

MeSH terms