Insulin hypersensitivity and resistance to streptozotocin-induced diabetes in mice lacking PTEN in adipose tissue
- PMID: 15743841
- PMCID: PMC1061603
- DOI: 10.1128/MCB.25.6.2498-2510.2005
Insulin hypersensitivity and resistance to streptozotocin-induced diabetes in mice lacking PTEN in adipose tissue
Abstract
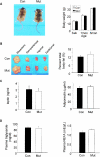
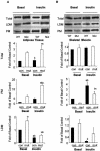
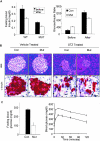
In adipose tissue, insulin controls glucose and lipid metabolism through the intracellular mediators phosphatidylinositol 3-kinase and serine-threonine kinase AKT. Phosphatase and a tensin homolog deleted from chromosome 10 (PTEN), a negative regulator of the phosphatidylinositol 3-kinase/AKT pathway, is hypothesized to inhibit the metabolic effects of insulin. Here we report the generation of mice lacking PTEN in adipose tissue. Loss of Pten results in improved systemic glucose tolerance and insulin sensitivity, associated with decreased fasting insulin levels, increased recruitment of the glucose transporter isoform 4 to the cell surface in adipose tissue, and decreased serum resistin levels. Mutant animals also exhibit increased insulin signaling and AMP kinase activity in the liver. Pten mutant mice are resistant to developing streptozotocin-induced diabetes. Adipose-specific Pten deletion, however, does not alter adiposity or plasma fatty acids. Our results demonstrate that in vivo PTEN is a potent negative regulator of insulin signaling and insulin sensitivity in adipose tissue. Furthermore, PTEN may be a promising target for nutritional and/or pharmacological interventions aimed at reversing insulin resistance.
Figures


Similar articles
-
Regulation of phosphoinositide metabolism, Akt phosphorylation, and glucose transport by PTEN (phosphatase and tensin homolog deleted on chromosome 10) in 3T3-L1 adipocytes.Mol Endocrinol. 2001 Aug;15(8):1411-22. doi: 10.1210/mend.15.8.0684. Mol Endocrinol. 2001. PMID: 11463863
-
PTEN, but not SHIP2, suppresses insulin signaling through the phosphatidylinositol 3-kinase/Akt pathway in 3T3-L1 adipocytes.J Biol Chem. 2005 Jun 10;280(23):22523-9. doi: 10.1074/jbc.M501949200. Epub 2005 Apr 11. J Biol Chem. 2005. PMID: 15824124
-
Decreased Akt kinase activity and insulin resistance in C57BL/KsJ-Leprdb/db mice.J Endocrinol. 2000 Oct;167(1):107-15. doi: 10.1677/joe.0.1670107. J Endocrinol. 2000. PMID: 11018758
-
Pten signaling in gliomas.Neuro Oncol. 2002 Jul;4(3):196-211. Neuro Oncol. 2002. PMID: 12084351 Free PMC article. Review.
-
Lipid phosphatases as a possible therapeutic target in cases of type 2 diabetes and obesity.Pharmacol Ther. 2006 Dec;112(3):799-809. doi: 10.1016/j.pharmthera.2006.06.001. Epub 2006 Jul 13. Pharmacol Ther. 2006. PMID: 16842857 Review.
Cited by
-
Thioredoxin and thioredoxin target proteins: from molecular mechanisms to functional significance.Antioxid Redox Signal. 2013 Apr 1;18(10):1165-207. doi: 10.1089/ars.2011.4322. Epub 2012 Jun 26. Antioxid Redox Signal. 2013. PMID: 22607099 Free PMC article. Review.
-
Selective enhancement of insulin sensitivity in the mature adipocyte is sufficient for systemic metabolic improvements.Nat Commun. 2015 Aug 5;6:7906. doi: 10.1038/ncomms8906. Nat Commun. 2015. PMID: 26243466 Free PMC article.
-
PTEN targeting: the search for novel insulin sensitisers provides new insight into obesity research.Diabetologia. 2007 Feb;50(2):247-9. doi: 10.1007/s00125-006-0547-2. Diabetologia. 2007. PMID: 17136390 No abstract available.
-
Phosphoinositides: Key modulators of energy metabolism.Biochim Biophys Acta. 2015 Jun;1851(6):857-66. doi: 10.1016/j.bbalip.2014.11.008. Epub 2014 Nov 20. Biochim Biophys Acta. 2015. PMID: 25463477 Free PMC article. Review.
-
Insulin hypersensitivity induced by hepatic PTEN gene ablation protects from murine endotoxemia.PLoS One. 2013 Jun 25;8(6):e67013. doi: 10.1371/journal.pone.0067013. Print 2013. PLoS One. 2013. PMID: 23825606 Free PMC article.
References
-
- Abel, E. D., O. Peroni, J. K. Kim, Y. B. Kim, O. Boss, E. Hadro, T. Minnemann, G. I. Shulman, and B. B. Kahn. 2001. Adipose-selective targeting of the GLUT4 gene impairs insulin action in muscle and liver. Nature 409:729-733. - PubMed
-
- Accili, D., J. Drago, E. J. Lee, M. D. Johnson, M. H. Cool, P. Salvatore, L. D. Asico, P. A. Jose, S. I. Taylor, and H. Westphal. 1996. Early neonatal death in mice homozygous for a null allele of the insulin receptor gene. Nat. Genet. 12:106-109. - PubMed
-
- Backers, K., D. Blero, N. Paternotte, J. Zhang, and C. Erneux. 2003. The termination of PI3K signalling by SHIP1 and SHIP2 inositol 5-phosphatases. Adv. Enzyme Regul. 43:15-28. - PubMed
-
- Banerjee, R. R., S. M. Rangwala, J. S. Shapiro, A. S. Rich, B. Rhoades, Y. Qi, J. Wang, M. W. Rajala, A. Pocai, P. E. Scherer, C. M. Steppan, R. S. Ahima, S. Obici, L. Rossetti, and M. A. Lazar. 2004. Regulation of fasted blood glucose by resistin. Science 303:1195-1198. - PubMed
Publication types
MeSH terms
Substances
Grants and funding
LinkOut - more resources
Full Text Sources
Other Literature Sources
Medical
Molecular Biology Databases
Research Materials
