Comparative Study
. 2005 May;16(5):2313-24.
doi: 10.1091/mbc.e04-09-0781. Epub 2005 Mar 2.

Profilin-mediated competition between capping protein and formin Cdc12p during cytokinesis in fission yeast

Affiliations
Comparative Study

Profilin-mediated competition between capping protein and formin Cdc12p during cytokinesis in fission yeast

David R Kovar et al. Mol Biol Cell. 2005 May.

Abstract

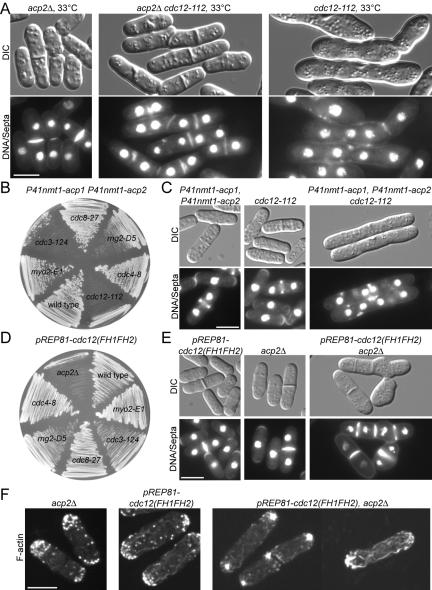
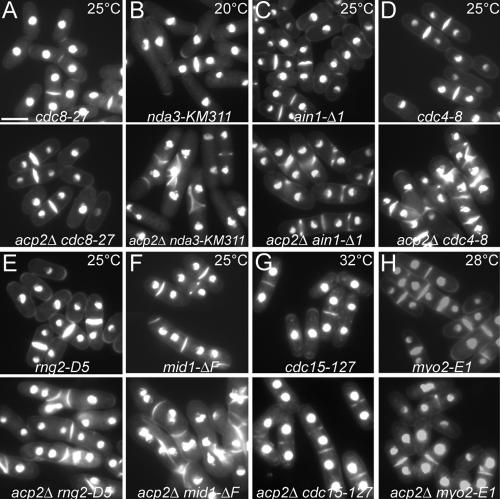
Fission yeast capping protein SpCP is a heterodimer of two subunits (Acp1p and Acp2p) that binds actin filament barbed ends. Neither acp1 nor acp2 is required for viability, but cells lacking either or both subunits have cytokinesis defects under stressful conditions, including elevated temperature, osmotic stress, or in combination with numerous mild mutations in genes important for cytokinesis. Defects arise as the contractile ring constricts and disassembles, resulting in delays in cell separation. Genetic and biochemical interactions show that the cytokinesis formin Cdc12p competes with capping protein for actin filament barbed ends in cells. Deletion of acp2 partly suppresses cytokinesis defects in temperature-sensitive cdc12-112 cells and mild overexpression of capping protein kills cdc12-112 cells. Biochemically, profilin has opposite effects on filaments capped with Cdc12p and capping protein. Profilin depolymerizes actin filaments capped by capping protein but allows filaments capped by Cdc12p to grow at their barbed ends. Once associated with a barbed end, either Cdc12p or capping protein prevents the other from influencing polymerization at that end. Given that capping protein arrives at the division site 20 min later than Cdc12p, capping protein may slowly replace Cdc12p on filament barbed ends in preparation for filament disassembly during ring constriction.


Figures

Figure 2.
Figure 2.
Late cytokinesis defects in the absence of capping protein. (A and B) DIC and fluorescence micrographs of wild-type (MLP198) and acp2Δ (KV301) cells expressing integrated myosin regulatory light chain-GFP (Rlc1p-GFP) from its native promoter and stained with Hoechst (bisbenzimide) to visualize nuclei and septa. Cells were grown exponentially in liquid minimal media at 36°C (A) or liquid minimal media with 1 M ethylene glycol at 25°C (B). (C and D) Effect of capping protein deletion on the time course of cytokinesis. Wild-type and acp2Δ cells expressing Rlc1p-GFP were initially grown exponentially in liquid YE5S complete media at 25°C or YE5S complete media with 1 M ethylene glycol at 25°C, and then washed and grown in minimal media plus 25% gelatin at 25°C with or without 1 M ethylene glycol. Fluorescence micrographs were recorded every minute. (C) Kymographs showing assembly, constriction, and disassembly of the Rlc1p-GFP contractile ring. Kymographs were constructed in ImageJ with a 5-μm slit across the midplane of the cell and aligned at the time of Rlc1p-GFP appearance at the division site (time = 0 min). (D) Plot of cytokinesis events versus time for (○) wild-type and (•) acp2Δ cells in minimal media or (□) wild-type and (▪) acp2Δ cells in minimal media with 1 M ethylene glycol. The arrival of SpCP at the division site is marked (Wu et al., 2003). At least 10 cells were analyzed for each condition. (E) Fluorescence micrographs of actin filaments stained with rhodamine-phalloidin in fixed wild-type (FY436) and acp1Δacp2Δ (KV149) cells grown exponentially in liquid minimal media at 36°C. (F) Colocalization of Acp2p-CFP with contractile ring actin filaments. Fixed cells expressing integrated Acp2p-CFP from its native promoter (KV184) were stained with DAPI for DNA and rhodamine-phalloidin for actin filaments and photographed with CFP, tetramethylrhodamine B isothiocyanate, and DAPI filters.
Figure 5.
Figure 5.
Antagonism of capping protein and the formin Cdc12p in cells. (A) A capping protein null mutant mildly suppresses a temperature sensitive cdc12 mutant. DIC and fluorescence micrographs of acp2Δ (KV21), cdc12-112 (MBY310), and acp2Δ cdc12-112 (KV81) cells grown at 33°C in YE5S complete liquid media for 10 h and stained with Hoechst to visualize DNA and septa. (B and C) Mild overexpression of SpCP kills cells with ts mutations of formin cdc12-112 and profilin cdc3-124 at a semipermissive temperature. (B) SpCP was mildly overexpressed (P41nmt1-acp1 P41nmt1-acp2) in various genetic backgrounds. Cells were streaked on minimal media without thiamine at 30°C for 72 h. (C) DIC and fluorescence micrographs of cells grown in liquid minimal media without thiamine for 20 h at 28°C and stained with Hoechst. (D–F) Low level overexpression of Cdc12(FH1FH2)p is lethal specifically in SpCP null cells. (D) The formin Cdc12(FH1FH2)p was weakly overexpressed from a plasmid [pREP81-cdc12(FH1FH2)] in various genetic backgrounds. Cells were streaked on minimal media without thiamine and grown at 30°C for 72 h. (E and F) DIC and fluorescence micrographs. Cells were grown in liquid minimal media without thiamine for 20 h at 28°C and then either stained with Hoechst (E) or fixed and stained with rhodamine-phalloidin (F) to visualize actin filaments. Bars, 5 μm.
Figure 6.
Figure 6.
Biochemical competition between SpCP and formin Cdc12p for actin filament barbed ends. The conditions were as follows: 10 mM imidazole, pH 7.0, 50 mM KCl, 1 mM MgCl2, 1 mM EGTA, 0.5 mM DTT, 0.2 mM ATP, 90 μM CaCl2, and 0.25% glycerol at 25°C. Polymer concentrations were measured by the fluorescence of pyrene-labeled actin. (A and B) Critical concentration for actin assembly. (A) Dependence of actin polymer concentration on total actin concentration with fits by linear regression. Actin (5% pyrene labeled) was assembled for 16 h. Conditions with critical concentrations: (▵) actin alone, Cc = 0.15 μM; (○) 100 nM SpCP, Cc = 0.9 μM; (•) 100 nM SpCP, 2.5 μM profilin, Cc = 1.95 μM; (□) 50 nM Cdc12(FH1FH2)p, Cc = 0.85 μM; (▪) 50 nM Cdc12(FH1FH2)p, 2.5 μM profilin, Cc = 0.1 μM. (B) Dependence of steady-state polymerization on profilin, SpCP, and Cdc12p. Actin filaments (5 μM, 10% pyrene labeled) were diluted to 1.5 μM in a range of profilin concentrations and incubated for 16 h. Conditions: (▵) actin alone, (○) 100 nM SpCP or (□) 50 nM Cdc12(FH1FH2)p. (C and D) Effects of profilin, SpCP, and Cdc12p on the time course of spontaneous assembly of 4 μM Mg-ATP actin (5% pyrene labeled). (C) Conditions: (thick curve) actin alone; (▵) 5 μM profilin; (○) 25 nM SpCP; (•) 25 nM SpCP, 5 μM profilin; (□) 10 nM Cdc12(FH1FH2)p; (▪) 10 nM Cdc12(FH1FH2)p, 5 μM profilin. (D) Conditions: (thick curve) actin alone; (□) 100 nM SpCP, 2.5 μM profilin; (∘ to ○) 100 nM SpCP, 2.5 μM profilin with a range of indicated Cdc12(FH1FH2)p concentrations (nM). (E–H) Effect of SpCP, mouse capping protein MmCP, and Cdc12(FH1FH2)p on elongation of the barbed ends of preassembled actin filaments. (E) Time course of elongation of barbed ends of 400 nM actin filaments upon addition of 1 μM actin (5% pyrene labeled). Conditions: (thick curve) actin alone; (○) 125 nM SpCP, 2.5 μM profilin; (□) 5 nM Cdc12(FH1FH2)p; (▪) 5 nM Cdc12(FH1FH2)p, 2.5 μM profilin; (⋄) 2.5 μM profilin with 125 nM SpCP and 5 nM Cdc12(FH1FH2)p added simultaneously. (♦) 1 μM actin with 5 nM Cdc12(FH1FH2)p and 2.5 μM profilin without preassembled filaments. (F) Effect of Cdc12(FH1FH2)p concentration on the initial rate of barbed end elongation of 400 nM actin filaments by 1 μM actin with 125 nM SpCP and 2.5 μM profilin. (G and H) Elongation of actin filaments preincubated with SpCP/MmCP or Cdc12p. (G) Time course of elongation of barbed ends of 400 nM actin filaments upon addition of 1 μM actin (5% pyrene labeled). Conditions: (thick curve) filaments were preincubated with buffer alone followed by actin and 2.5 μM profilin, (○) filaments were preincubated with 125 nM SpCP followed by actin with 5 nM Cdc12(FH1FH2)p and 2.5 μM profilin, (⋄) filaments were preincubated with 5 nM Cdc12(FH1FH2)p followed by actin with 125 nM SpCP and 2.5 μM profilin, (□) filaments were preincubated with buffer alone followed by actin with 5 nM Cdc12(FH1FH2)p, 125 nM SpCP and 2.5 μM profilin. (H) Time course of elongation of barbed ends of 400 nM actin filaments upon addition of 1 μM actin (5% pyrene labeled). Conditions: (thick curve) filaments were preincubated with buffer alone followed by actin and 2.5 μM profilin, (○) filaments were preincubated with 10 nM MmCP followed by actin with 5 nM Cdc12p and 2.5 μM profilin, (⋄) filaments were preincubated with 5 nM Cdc12(FH1FH2)p followed by actin with 10 nM MmCP and 2.5 μM profilin, (□) filaments were preincubated with buffer alone followed by actin with 5 nM Cdc12(FH1FH2)p, 10 nM MmCP, and 2.5 μM profilin.
Figure 1.
Figure 1.
Biochemical comparison of purified SpCP and MmCP. The conditions were as follows: 10 mM imidazole, pH 7.0, 50 mM KCl, 1 mM MgCl2, 1 mM EGTA, 0.5 mM DTT, 0.2 mM ATP, 90 μM CaCl2, and 0.25% glycerol at 25°C. (A) A Coomassie Blue-stained gel showing purification of SpCP. Lane 1, bacteria extract; lane 2, 45–65% ammonium sulfate cut; lane 3, DE52 column; lane 4, Hydroxyapatite column; lane 5, Source 15Q column, pH 7.5; and lane 6, Source 15Q column, pH 6.0. Molecular weights are indicated on the left. (B and C) Critical concentration for assembly of rabbit skeletal muscle actin. (B) Dependence of actin polymer concentration on total actin concentration in the (•) absence or presence of either (□) 15 nM MmCP (○) 150 nM SpCP. Actin (5% pyrene labeled) was assembled for 16 h. The polymer concentration was measured from the pyrene fluorescence, plotted versus actin concentration, and fit by linear regression. The Cc values were 0.1 μM for actin alone, 0.95 μM with 15 nM MmCP, and 0.90 M with 150 μ nM SpCP. (C) Dependence of the polymer concentration of 1 μM actin on the concentration of (□) MmCP or (○) SpCP. Actin filaments (5 μM) (10% pyrene labeled) were diluted to 1 μM in the presence of a range of CP concentrations. After 16 h, the pyrene fluorescence was measured, and the actin polymer concentration was plotted versus the log of CP concentration. (D–F) Direct visualization of the effect of capping protein on growing actin filaments by time-lapse evanescent wave fluorescence microscopy. Mg-ATP actin (1.0 μM) with 0.25 or 0.65 μM Oregon green (OG) 488-labeled Mg-ATP actin. Black triangles indicate time when the second solution replaced the initial solution. Left, kymograph of the length (y-axis) of a representative filament versus time (x-axis; 1200 s). Right, lifetime plots for eight filaments of the growth of barbed and pointed ends versus time. An initial solution that contained 1.0 μM actin with 0.25 μM OG-actin was followed by a second solution that contained 1.0 μM actin with 0.65 μM OG-actin (D) alone, or with either (E) 10 nM MmCP or (F) 250 nM SpCP. (G and H) Barbed end addition of monomer to preassembled actin filaments in the presence of capping protein. (G) Time course of the assembly of 1 μM actin (5% pyrene labeled) saturated with 5 μM profilin upon addition to 400 nM actin filaments (thick curve) alone, or in the presence of either (•) 2.5, (▪) 5 and (□) 10 nM MmCP or (○) 10, (□) 35 and (□) 100 nM SpCP. (H) Dependence of the initial rate of barbed end assembly on the concentration of (□) MmCP or (○) SpCP. Curve fits of the plotted data (see Materials and Methods) revealed dissociation equilibrium constants of 0.8 nM for MmCP and 16 nM for SpCP. (I and J) Time course of the depolymerization of 5 μM actin filaments (70% pyrene labeled) after dilution to 0.1 μM in the (thick curve) absence or presence of (□) 1 nM MmCP, (▪) 5 nM MmCP, (○) 10 nM SpCP, and (•) 250 nM SpCP. (J) Dependence of the rate of depolymerization on the concentration of (□) MmCP or (○) SpCP. The data from 300 to 1000 s of each curve was fit with single exponentials, and the depolymerization rates were expressed as a fraction of the rate of actin alone. (K and L) Time course of the spontaneous assembly of 4 μM Mg-ATP actin (5% pyrene labeled) in the absence (thick curve) or presence of either a range of concentrations of MmCP (•) 5 nM, (▪) 25 nM, and (□) 100 nM, or a range of concentrations of SpCP, (□) 5 nM, (○) 25 nM, and (□) 100 nM. (L) Biphasic dependence of the concentration of apparent ends (nanomolar) on the concentration of SpCP calculated from the rate of polymerization at the time where 25% (1 μM) of the actin was polymerized. (M) Effects of capping protein on actin filament annealing. Merged micrographs of red and green fluorescence are shown. Equal concentrations (0.25 μM) of red (rhodamine-phalloidin)- and green (Alexa green-phalloidin)–labeled actin filaments were sheared through a 26-gauge needle in the absence or presence of the indicated concentrations of CP and allowed to anneal for 60 min before dilution and absorption to poly-l-lysine–coated coverslips. Bar, 5 μm.
Figure 3.
Figure 3.
Overexpression of capping protein causes a specific lethal defect in cytokinesis. (A–D) Wild-type, capping protein α-subunit overexpressing (P3nmt1-acp1; KV37), capping protein β-subunit overexpressing (P3nmt1-acp2; KV40), and both α- and β-subunit overexpressing (P3nmt1-acp1 P3nmt1-acp2; KV56) cells were grown in liquid minimal media with 0.2 μM thiamine at 25°C. Overexpression was induced by washing the cells in media without thiamine and allowing them to grow 18–24 h more at 25°C. (A) Overexpression of both capping protein subunits is required for a defect in cytokinesis. DIC and fluorescent micrographs of wild-type and capping protein overexpressing cells (24 h) stained with Hoechst to visualize DNA and septa. (B and C) Cells overexpressing capping protein cannot form contractile rings. (B) DIC and fluorescent micrographs of cells stained with Hoechst that are overexpressing capping protein (18 h) and expressing either GFP-myosin essential light chain (pGFP-Cdc4p; KV295) or YFP-tropomyosin (pYFP-Cdc8p; KV296) from plasmids. (C) Fluorescent micrographs of cells fixed and stained with DAPI (DNA) and rhodamine-phalloidin (actin filaments) that were overexpressing only the capping protein α subunit or both capping protein subunits for 20 h. (D) DIC and fluorescent micrographs of cells expressing Cdc12-3XGFP and overexpressing capping protein for 0 or 18 h. Nuclei and septa were stained with Hoechst. Bars, 5 μm.
Figure 4.
Figure 4.
Genetic interactions of capping protein null mutants with other mutations. Fluorescent micrographs of single and double mutant cells grown at the indicated temperature in complete YE5S liquid media and stained with Hoechst to visualize DNA and septa. (A) An example of no genetic interaction. Capping protein and tropomyosin: acp2Δ cdc8-27 (KV79). (B–G) Synthetic interactions where double mutant were sicker than either single mutant. (B) Capping protein and β-tubulin: acp2Δ nda-KM311 (KV134). (C) Capping protein and α-actinin: acp2Δ ain11 (KV67). (D) Capping protein and myosin essential light chain: acp2Δ cdc4-8 (KV85). (E) Capping protein and IQGAP: acp2Δ rng2-D5 (KV132). (F) Capping protein and anillin-like: acp2Δ mid1F (KV136). (G) Capping protein and PCH protein: acp2Δ cdc15-127 (KV83). (H) Suppression where the double mutant of capping protein null and type II myosin ts (acp2Δ myo2-E1, KV105) was healthier than the myo2-E1 single mutant. Bar, 5 μm.

References

    1. Amatruda, J. F., Cannon, J. F., Tatchell, K., Hug, C., and Cooper, J. A. (1990). Disruption of the actin cytoskeleton in yeast capping protein mutants. Nature 344, 352–354. - PubMed
    1. Amatruda, J. F., and Cooper, J. A. (1992). Purification, characterization, and immunofluorescence localization of Saccharomyces cerevisiae capping protein. J. Cell Biol. 117, 1067–1076. - PMC - PubMed
    1. Amatruda, J. F., Gattermeir, D. J., Karpova, T. S., and Cooper, J. A. (1992). Effects of null mutations and overexpression of capping protein on morphogenesis, actin distribution and polarized secretion in yeast. J. Cell Biol. 119, 1151–1162. - PMC - PubMed
    1. Bahler, J., Wu, J. Q., Longtine, M. S., Shah, N. G., McKenzie, A., 3rd, Steever, A. B., Wach, A., Philippsen, P., and Pringle, J. R. (1998). Heterologous modules for efficient and versatile PCR-based gene targeting in Schizosaccharomyces pombe. Yeast 14, 943–951. - PubMed
    1. Balasubramanian, M. K., Hirani, B. R., Burke, J. D., and Gould, K. L. (1994). The Schizosaccharomyces pombe cdc3+ gene encodes a profilin essential for cytokinesis. J. Cell Biol. 125, 1289–1301. - PMC - PubMed

Publication types

MeSH terms