

Global analysis of circadian expression in the cyanobacterium Synechocystis sp. strain PCC 6803
- PMID: 15743968
- PMCID: PMC1064041
- DOI: 10.1128/JB.187.6.2190-2199.2005
Global analysis of circadian expression in the cyanobacterium Synechocystis sp. strain PCC 6803
Abstract
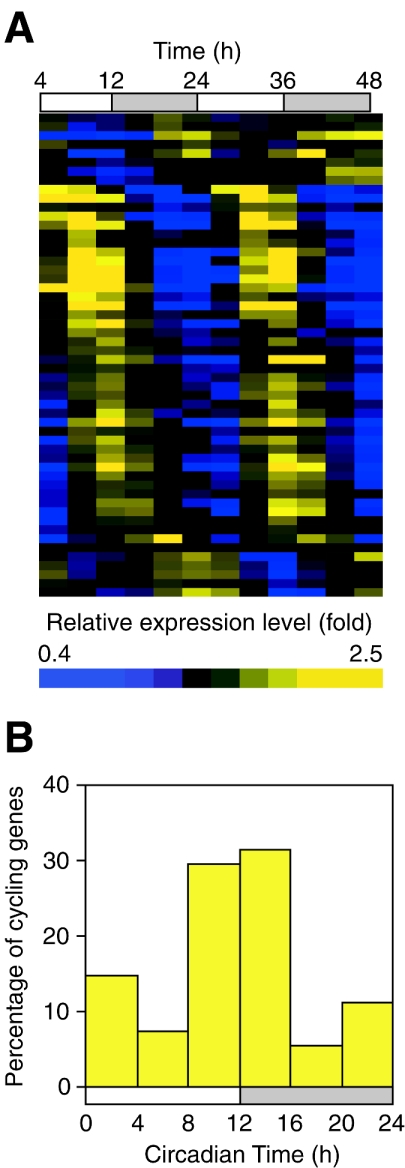
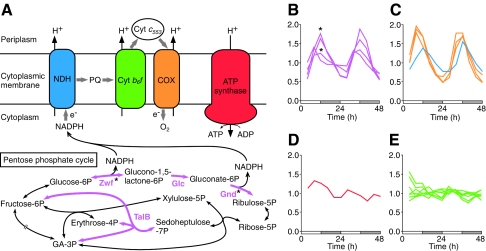
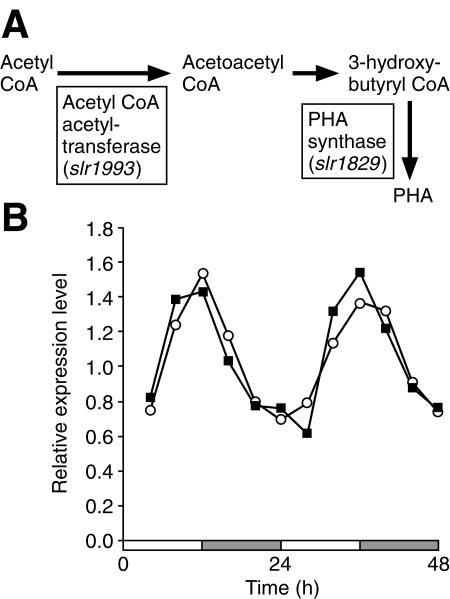
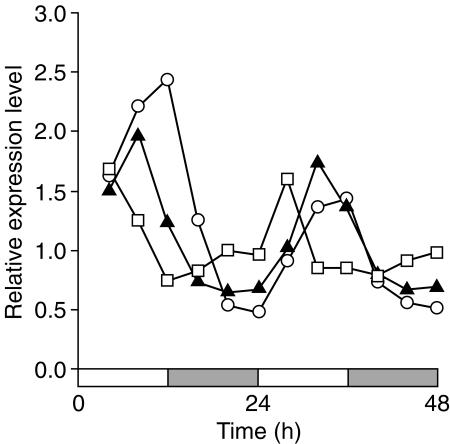
Cyanobacteria are the only bacterial species found to have a circadian clock. We used DNA microarrays to examine circadian expression patterns in the cyanobacterium Synechocystis sp. strain PCC 6803. Our analysis identified 54 (2%) and 237 (9%) genes that exhibited circadian rhythms under stringent and relaxed filtering conditions, respectively. The expression of most cycling genes peaked around the time of transition from subjective day to night, suggesting that the main role of the circadian clock in Synechocystis is to adjust the physiological state of the cell to the upcoming night environment. There were several chromosomal regions where neighboring genes were expressed with similar circadian patterns. The physiological functions of the cycling genes were diverse and included a wide variety of metabolic pathways, membrane transport, and signal transduction. Genes involved in respiration and poly(3-hydroxyalkanoate) synthesis showed coordinated circadian expression, suggesting that the regulation is important for the supply of energy and carbon source in the night. Genes involved in transcription and translation also followed circadian cycling patterns. These genes may be important for output of the rhythmic information generated by the circadian clock. Our findings provided critical insights into the importance of the circadian clock on cellular physiology and the mechanism of clock-controlled gene regulation.
Figures
Similar articles
-
Diurnal Regulation of Cellular Processes in the Cyanobacterium Synechocystis sp. Strain PCC 6803: Insights from Transcriptomic, Fluxomic, and Physiological Analyses.mBio. 2016 May 3;7(3):e00464-16. doi: 10.1128/mBio.00464-16. mBio. 2016. PMID: 27143387 Free PMC article.
-
Integrative analysis of large scale expression profiles reveals core transcriptional response and coordination between multiple cellular processes in a cyanobacterium.BMC Syst Biol. 2010 Aug 2;4:105. doi: 10.1186/1752-0509-4-105. BMC Syst Biol. 2010. PMID: 20678200 Free PMC article.
-
Growth-phase dependent differential gene expression in Synechocystis sp. strain PCC 6803 and regulation by a group 2 sigma factor.Arch Microbiol. 2007 Apr;187(4):265-79. doi: 10.1007/s00203-006-0193-6. Epub 2006 Dec 12. Arch Microbiol. 2007. PMID: 17160677
-
A cyanobacterial circadian timing mechanism.Annu Rev Genet. 2003;37:513-43. doi: 10.1146/annurev.genet.37.110801.142716. Annu Rev Genet. 2003. PMID: 14616072 Review.
-
A circadian timing mechanism in the cyanobacteria.Adv Microb Physiol. 2007;52:229-96. doi: 10.1016/S0065-2911(06)52004-1. Adv Microb Physiol. 2007. PMID: 17027373 Review.
Cited by
-
Prochlorococcus and Synechococcus have Evolved Different Adaptive Mechanisms to Cope with Light and UV Stress.Front Microbiol. 2012 Aug 8;3:285. doi: 10.3389/fmicb.2012.00285. eCollection 2012. Front Microbiol. 2012. PMID: 23024637 Free PMC article.
-
A day in the life of microcystis aeruginosa strain PCC 7806 as revealed by a transcriptomic analysis.PLoS One. 2011 Jan 19;6(1):e16208. doi: 10.1371/journal.pone.0016208. PLoS One. 2011. PMID: 21283831 Free PMC article.
-
The circadian clock regulates auxin signaling and responses in Arabidopsis.PLoS Biol. 2007 Aug;5(8):e222. doi: 10.1371/journal.pbio.0050222. PLoS Biol. 2007. PMID: 17683202 Free PMC article.
-
Regulatory Diversity and Functional Analysis of Two-Component Systems in Cyanobacterium Synechocystis sp. PCC 6803 by GC-MS Based Metabolomics.Front Microbiol. 2020 Mar 17;11:403. doi: 10.3389/fmicb.2020.00403. eCollection 2020. Front Microbiol. 2020. PMID: 32256471 Free PMC article.
-
Effect of continuous light on diurnal rhythms in Cyanothece sp. ATCC 51142.BMC Genomics. 2009 May 15;10:226. doi: 10.1186/1471-2164-10-226. BMC Genomics. 2009. PMID: 19445672 Free PMC article.
References
-
- Akhtar, R. A., A. B. Reddy, E. S. Maywood, J. D. Clayton, V. M. King, A. G. Smith, T. W. Gant, M. H. Hastings, and C. P. Kyriacou. 2002. Circadian cycling of the mouse liver transcriptome, as revealed by cDNA microarray, is driven by the suprachiasmatic nucleus. Curr. Biol. 12:540-550. - PubMed
-
- Aoki, S., T. Kondo, and M. Ishiura. 2002. A promoter-trap vector for clock-controlled genes in the cyanobacterium Synechocystis sp. PCC 6803. J. Microbiol. Methods 49:265-274. - PubMed
Publication types
MeSH terms
Substances
LinkOut - more resources
Full Text Sources
Other Literature Sources
