Therapeutic effects of Holmium-166 chitosan complex in rat brain tumor model
- PMID: 15744805
- PMCID: PMC2823057
- DOI: 10.3349/ymj.2005.46.1.51
Therapeutic effects of Holmium-166 chitosan complex in rat brain tumor model
Abstract
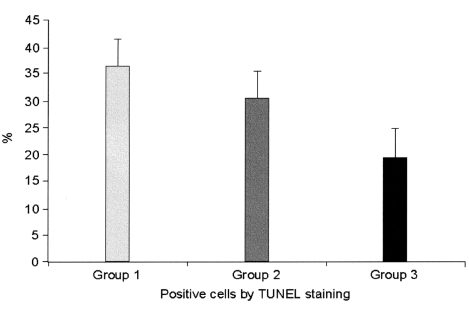
This study examined the effectiveness of Holmium-166 (Ho-166) chitosan complex therapy for a malignant glioma. Cultured C6 glioma cells (100,000 in 5 microl) were injected into the caudate/putamen of 200-250 gram Wistar rats. Five days later, a Ho-166 chitosan complex was injected into the same site of the glioma injection. Four injection doses were administered: the control group received PBS 10 microl, group 1 received an injection of 100 microCi (10 microl), group 2 received an injection of 50 microCi (5 microl), and group 3 received an injection of 10 microCi (1 microl). The average tumor volume for each group was 1.385 mm3 for the control group, 0.036 mm3 for group 1, 0.104 mm3 for group 2, and 0.111 mm3 for group 3. Compared with the control group, the size of the tumors in groups 1, 2 and 3 was reduced by an average of 97.4%, 92.5% and 91.9%, respectively. The Kaplan-Meier survival curve of group 2 was the longest, followed by groups 3, group 1 and the control. The mean survival was 22.8, 59, 60, and 44.6 days for the control group and groups 3, 2 and 1, respectively. H-E staining revealed that group 2 yielded the best results in the destruction of the malignant glioma. TUNEL staining and immunohistochemical studies indicated apoptotic features. The Ho-166 chitosan complex proved to be effective in destroying the malignant glioma.
Figures


References
-
- Chang JW, Lee H, Kim E, Lee Y, Chung SS, Kim JH. Combined antitumor effects of an Adenoviral Cytosine Deaminase/Thymidine Kinase fusion gene in rat c6 glioma. Neurosurgery. 2000;47:931–939. - PubMed
-
- Brandes A, Soesan M, Fiorentino MV. Medical treatment of high grade malignant glioma in adults: An overview. Anticancer Res. 1991;11:719–727. - PubMed
-
- Nieder C, Grosu AL, Molls M. A comparison of treatment results for recurrent malignant gliomas. Cancer Treat Rev. 2000;26:397–409. - PubMed
-
- Bampoe J, Glen J, Hubbard SL, Salhia B, Shannon P, Rutka J, et al. Adenoviral vector-mediated gene transfer: timing of wild-type p53 gene expression in vivo and effect of tumor transduction on survival in a rat glioma brachytherapy model. J Neurooncol. 2000;49:27–39. - PubMed
-
- Bampoe J, Laperriere N, Pintilie M, Glen J, Micallef J, Bernstein M. Quality of life in patients with glioblastoma multiforme participating in a randomized study of brachytherapy as a boost treatment. J Neurosurg. 2000;93:917–926. - PubMed
Publication types
MeSH terms
Substances
LinkOut - more resources
Full Text Sources
Other Literature Sources
Medical