Comparative Study
. 2005 Mar 2;25(9):2181-91.
doi: 10.1523/JNEUROSCI.4570-04.2005.

Trafficking of a ligand-receptor complex on the growth cones as an essential step for the uptake of nerve growth factor at the distal end of the axon: a single-molecule analysis

Affiliations
Comparative Study

Trafficking of a ligand-receptor complex on the growth cones as an essential step for the uptake of nerve growth factor at the distal end of the axon: a single-molecule analysis

Tomomi Tani et al. J Neurosci. .

Abstract

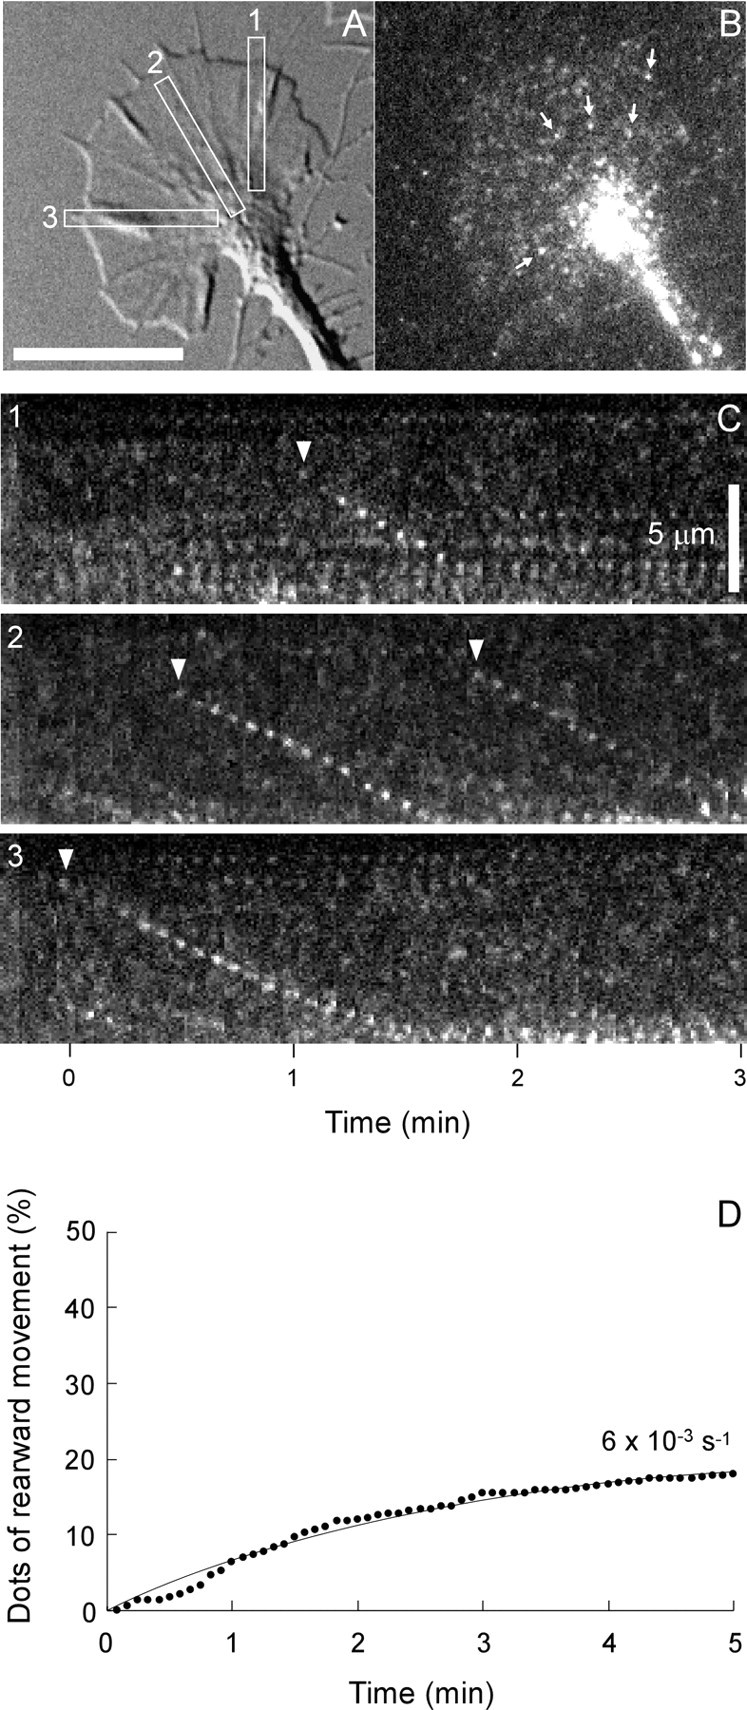
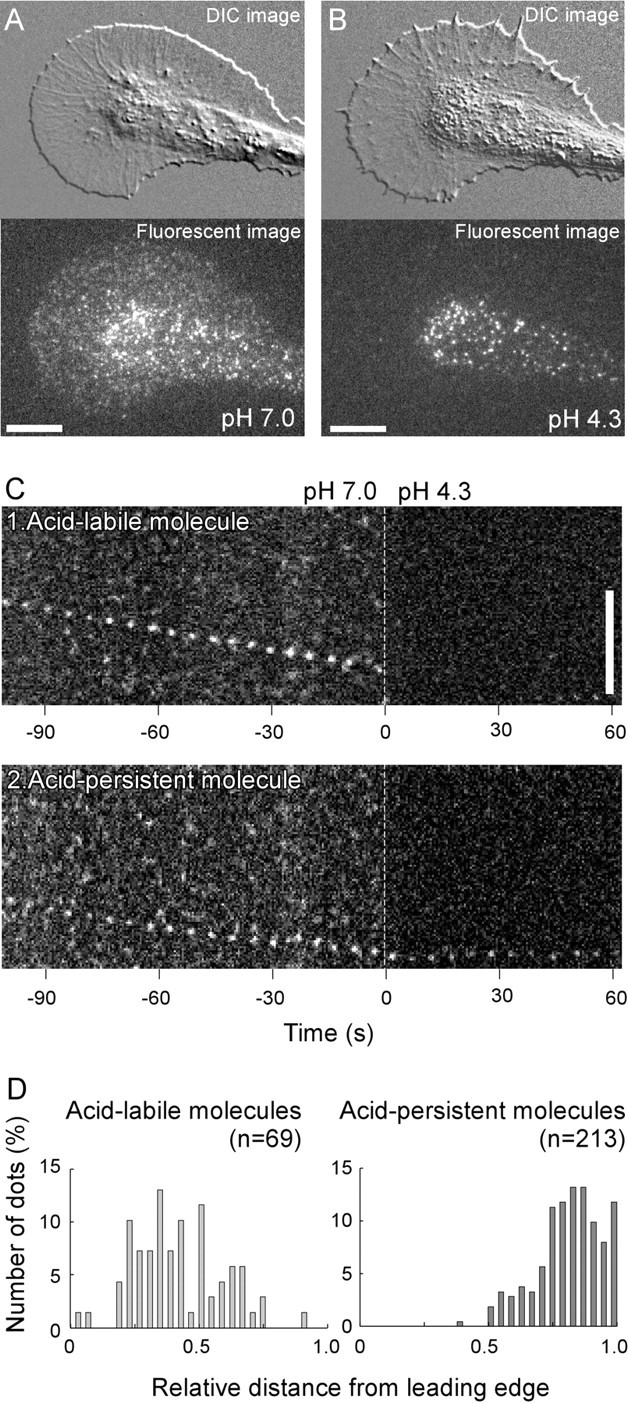
The behavior of single molecules of neurotrophins on growth cones was observed by the use of the fluorescent conjugate of nerve growth factor (NGF), Cy3-NGF. After the application of 0.4 nm Cy3-NGF, chick dorsal root ganglion growth cones responded within 1 min of adding the stimulus by expanding their lamellipodia. Only 40 molecules of Cy3-NGF, which occupied <5% of the estimated total binding sites on a single growth cone, were required to initiate the motile responses. After binding to the high-affinity receptor, Cy3-NGF displayed lateral diffusion on the membrane of the growth cones with a diffusion constant of 0.3 microm2 s(-1). The behavior of Cy3-NGF was shifted to a one-directional rearward movement toward the central region of the growth cone. The one-directional movement of Cy3-NGF displayed the same rate as the rearward flow of actin, approximately 4 microm/min. This movement could be stopped by the application of the potent inhibitor of actin polymerization, latrunculin B. Molecules of Cy3-NGF were suggested to be internalized in the vicinity of the central region of the growth cone during this rearward trafficking, because Cy3-NGF remained in the growth cone after the growth cones had been exposed to an acidic surrounding medium: acidic medium causes the complete dissociation of Cy3-NGF from the receptors on the surface of growth cones. These results suggested that actin-driven trafficking of the NGF receptor complex is an essential step for the accumulation and endocytosis of NGF at the growth cone and for the retrograde transport of NGF toward the cell body.


Figures

Figure 1.
Figure 1.
Responses of dorsal root ganglion growth cones on application of fluorescent nerve growth factor Cy3-NGF. Consecutive epifluorescent images (A) and DIC images (B) of a single dorsal root ganglion growth cone before and after the application of Cy3-NGF are shown. Cy3-NGF (final concentration, 0.4 nm) was uniformly applied to the growth cone at 0 min. Images were taken with 50 ms exposure time without binning. Scale bar, 10 μm.
Figure 2.
Figure 2.
The time courses of Cy3-NGF binding and the evoked motile responses of the dorsal root ganglion growth cone. A, Time courses of the increase in the averaged fluorescent intensity measured at the central region (○) and at the lamellipodial region (•) after the application of Cy3-NGF (t = 0 min). Inset, Fluorescent micrograph of the growth cone to show the boundary lines of the central region and lamellipodial region used for the measurement. B, A time course of change in the apparent area of the growth cone beyond the broken line in Figure 1B. Inset, Example of a DIC micrograph to show the measured area of the growth cone (enclosed in a black line). photons/s, Photons per second.
Figure 3.
Figure 3.
Fluorescent dots on the dorsal root ganglion growth cone represent the single molecules of Cy3-NGF. A, A DIC image (left) and a fluorescent image (right) of the dorsal root ganglion growth cone incubated with 0.4 nm Cy3-NGF for 10 min. The fluorescent image was taken with an exposure time of 80 ms and 2 × 2 binning. Scale bar, 10 μm. B, Histogram of the fluorescent intensity of dots and clusters observed on the fluorescent image of a growth cone (n = 294). A sum of three Gaussian curves is superimposed on the histogram. The peak, mean, and SD of Gaussian functions were fit to the graph. C, The photobleaching process of the single fluorescent dot on the growth cone. Timing of the data (n = 4) was aligned at the moment of photobleaching (t = 0 s) to present the average of the fluorescent intensities before and after photobleaching.
Figure 4.
Figure 4.
Local kinetics of the binding of NGF and the receptors on the growth cones. A, The increase in fluorescent dots bound onto a single growth cone after the application of 0.4 nm Cy3-NGF. The fitted single exponential curve is superimposed on the plot. B, The averaged number of bound fluorescent dots on the growth cones as a function of various concentrations (0, 0.004, 0.04, 0.1, 0.2, and 0.4 nm) of applied Cy3-NGF. The solution of the fitted curve, y = 175x/(2.7 × 10-11 + x), is superimposed on the plot. Each point is a mean of eight values; the vertical bar at each point indicates the SD. C, The averaged fluorescent intensities of the growth cones were plotted against various concentrations of applied Cy3-NGF (from 0.01 to 100 nm) in the culture medium. The solution of the curve with the best fit, y = {185x/(3.5 × 10-11 + x)} + {653x/(7.7 × 10-9 + x)}, is superimposed on the plot. Each point is a mean of 5-15 values; the vertical bar at each point indicates the SD. C, Inset, Correlation plot of the number of fluorescent dots (horizontal axis) and the averaged fluorescent intensity (vertical axis) on the growth cone when 0.4 nm of Cy3-NGF was applied to the growth cone. A linear regression line, y = 0.916 n, where n is the number of bound fluorescent dots and y is the averaged fluorescent intensity, is superimposed on the plot.
Figure 5.
Figure 5.
The two modes of the movement of single Cy3-NGF molecules. A, Diffusive movement of Cy3-NGF on the growth cone. Trajectories of four fluorescent dots were tracked for 10 s on the growth cone that had been incubated in the medium with 0.4 nm Cy3-NGF and drawn on a DIC photograph of the same growth cone. Scale bar, 10 μm. B, One-directional movement of Cy3-NGF on the growth cone. Trajectories of 13 fluorescent dots showing one-directional movement were tracked for 1 min on a growth cone incubated in 0.2 nm Cy3-NGF and drawn on a DIC photograph of the same growth cone. Scale bar, 10 μm. C, MSD plot of the diffusive motions of fluorescent dots (n = 16). A linear regression line, y = 1.23 t, is superimposed on the plot. D, MSD plot of the fluorescent dots showing the one-directional motions (n = 16). The regression curve with the best fit, y = 0.038 t + 0.0035 t2 is superimposed on the plot. E, Histogram of fluorescent intensities of diffusing dots (top; n = 309) and of one-directional movement (bottom; n = 70). The Gaussian curve with the best fit had a central value of 1000 photons per second for the diffusing dots and 1005 photons per second for the dots of one-directional movement, respectively.
Figure 6.
Figure 6.
Behavioral transition of Cy3-NGF on the growth cone: from diffusive motion to one-directional rearward movement. ADIC image (A) and afluorescent image (B) of the growth cone after the removal of Cy3-NGF from the surrounding medium. Fluorescent images were taken with an exposure time of 100 ms without binning. Scale bar, 10 μm. C, Consecutive fluorescent images (intervals, 5 s) of the three areas (1-3) enclosed in the white rectangles in Figure 5A were taken and aligned side by side from left to right. Downward progression of dots in the consecutive images corresponds to the one-directional movement toward the central region. White arrowheads indicate Cy3-NGF dots that have started one-directional rearward movement. D, The time course of increase in the number of fluorescent dots that started and continued one-directional movement in the lamellipodial region. The numbers of fluorescent dots were averaged and normalized so that the initial number of diffusing dots in the lamellipodial region was 100% (n = 4).
Figure 7.
Figure 7.
Actin-driven trafficking of Cy3-NGF toward the central region of the growth cone. A, Simultaneous observation of Cy3-NGF trafficking (a, c) and rearward flow of actin stained by Alexa 647-phalloidin (b, d). In c and d, consecutive fluorescent images (intervals, 5 s) of the areas enclosed in the white rectangles in a and b were aligned side by side from left to right, respectively. Fluorescent images were taken with an exposure time of 400 ms without binning. Scale bars, 5 μm. B, The effect of 200 nm latrunculin B on the rearward movement of single Cy3-NGF-receptor complexes. The traveled distances of five fluorescent dots on a single growth cone were plotted against time; 200 nm latrunculin B was added at 1.2 min. C, Changes in fluorescent intensities at the central region (○) and at the lamellipodial region (•) of the growth cone after the application of 0.4 nm Cy3-NGF in the absence (top plots) and presence (bottom plots) of 1 μm latrunculin B. D, DIC images (left) and fluorescent images (right) of dorsal root ganglion growth cones incubated with 0.4 nm Cy3-NGF for 20 min. Five minutes before the application of Cy3-NGF, latrunculin B (final concentration, 1 μm) was applied to the growth cone shown in the bottom photographs. Fluorescent images were taken with an exposure time of 80 ms without binning. Scale bars, 10 μm.
Figure 8.
Figure 8.
Observation of endocytosed Cy3-NGF in the DRG growth cones. A, B, DIC images and fluorescent images of the growth cone before (A) and after (B) the acidification of surrounding medium. Fluorescent images were taken with an exposure time of 50 ms without binning. Scale bars, 10 μm. C, Consecutive fluorescent images of single Cy3-NGF molecule on the rearward traffic before and after the acidification of surrounding medium. Examples of (1) acidlabile molecules and that of (2) acid-persistent molecules are shown. Fluorescent images were taken at intervals of 5 s and aligned from left to right. The vertical white broken line indicates the time of acidification of the culture medium (t = 0). Scale bar, 10 μm. D, Histograms of the location of acid-labile (left) and acid-persistent (right) fluorescent dots that were exhibiting one-directional movement when an acidic culture medium was applied. The locations of fluorescent dots on the rearward flow were expressed as normalized distances from the leading edge of the lamellipodium so that the leading edge of the lamellipodium was 0 and the margin of the central region was 1.0. The numbers of acid-labile and persistent dots were expressed as percentages of the total number of dots observed.
Figure 9.
Figure 9.
The model of NGF binding, trafficking, and uptake at the dorsal root ganglion growth cone. A, Schematic diagram showing the side view of the dissected growth cone during NGF uptake based on our observation of Cy3-NGF. B, Simulated time courses of the numbers of LR, LRtr, and LRendo (solid lines) and R, LR*, and LRaxon (broken lines) in a single growth cone based on the diagram in Figure 9A and Scheme 1 in Discussion. The following constants were used for the calculation: concentration of Cy3-NGF, 4 × 10⁻¹⁰ m; number of free receptors at t = 0, 175; kon = 2.8 × 10⁷ m-1 s-1 and ktr = 6 × 10⁻³ s-1. koff = 6 × 10⁻⁴ s-1 was estimated from the kon and the dissociation constant, Kd. The rate of insertion of new receptors to the surface membrane was assumed to be proportional to the concentration of activated ligand-receptor complexes, LR*, with the rate constant, ks = 5 × 10⁻³ s-1. The value for kaxon, 1 × 10⁻³ s-1, was obtained preliminarily, and the values for kact = 1 × 10⁻³ s-1, kinact = 1 × 10⁻⁴ s-1, and kendo = 2.5 × 10⁻³ s-1 were determined by trial and error until the simulated time courses matched the experimentally obtained time courses of LR, LRtr, and LRendo.

Similar articles

Cited by

References

    1. Axelrod D (1981) Cell-substrate contacts illuminated by total internal reflection fluorescence. J Cell Biol 89: 141-145. - PMC - PubMed
    1. Bronfman FC, Tcherpakov M, Jovin TM, Fainzilber M (2003) Ligand-induced internalization of the p75 neurotrophin receptor: a slow route to the signaling endosome. J Neurosci 23: 3209-3220. - PMC - PubMed
    1. Campenot RB (1977) Local control of neurite development by nerve growth factor. Proc Natl Acad Sci USA 74: 4516-4519. - PMC - PubMed
    1. Chao MV, Bothwell MA, Ross AH, Koprowski H, Lanahan AA, Buck CR, Sehgal A (1986) Gene transfer and molecular cloning of the human NGF receptor. Science 232: 518-521. - PubMed
    1. Claude P, Hawrot E, Dunis DA, Campenot RB (1982) Binding, internalization, and retrograde transport of 125I-nerve growth factor in cultured rat sympathetic neurons. J Neurosci 2: 431-442. - PMC - PubMed

Publication types

MeSH terms

LinkOut - more resources