Comparative Study
. 2005 Mar 2;25(9):2192-203.
doi: 10.1523/JNEUROSCI.3965-04.2005.

Properties of synaptically evoked astrocyte calcium signal reveal synaptic information processing by astrocytes

Affiliations
Comparative Study

Properties of synaptically evoked astrocyte calcium signal reveal synaptic information processing by astrocytes

Gertrudis Perea et al. J Neurosci. .

Erratum in

  • J Neurosci. 2005 Mar 16;25(11):3022

Abstract

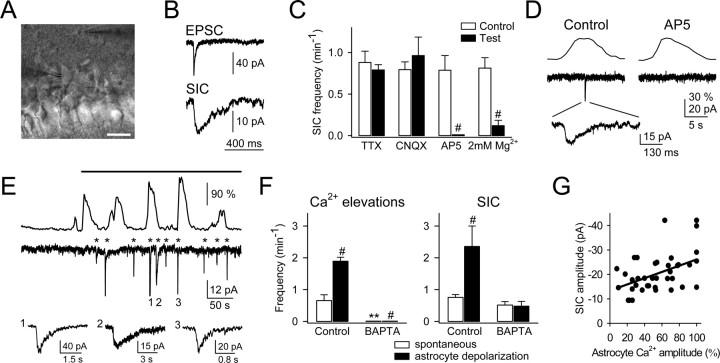
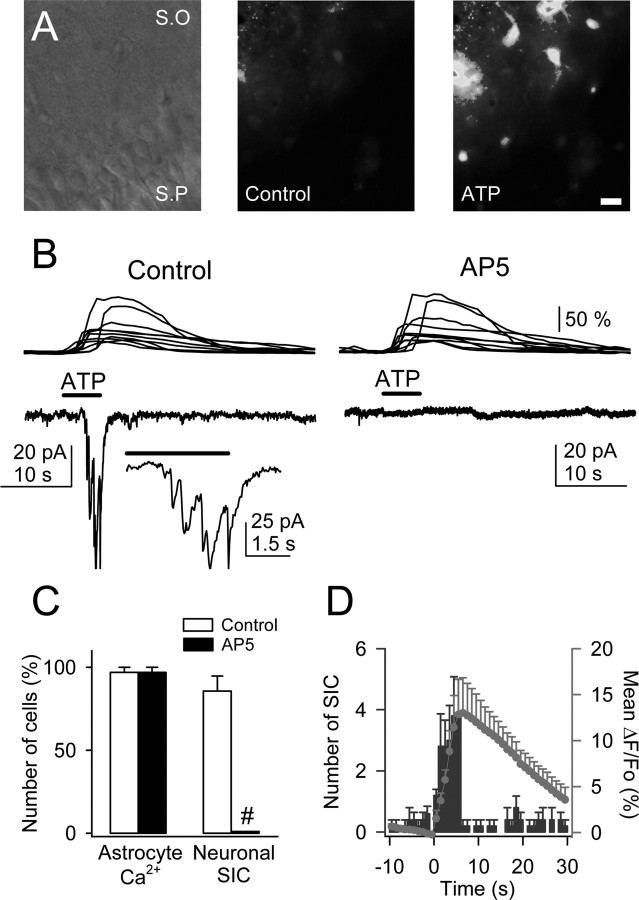
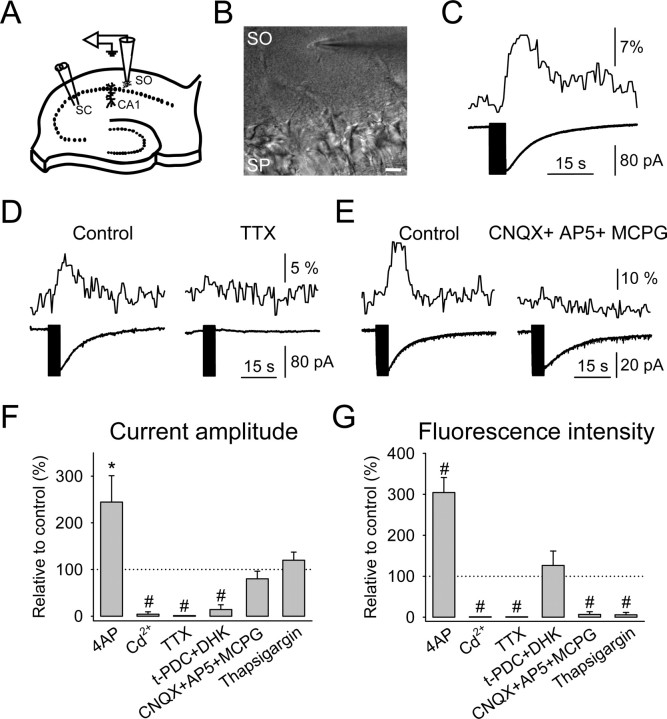
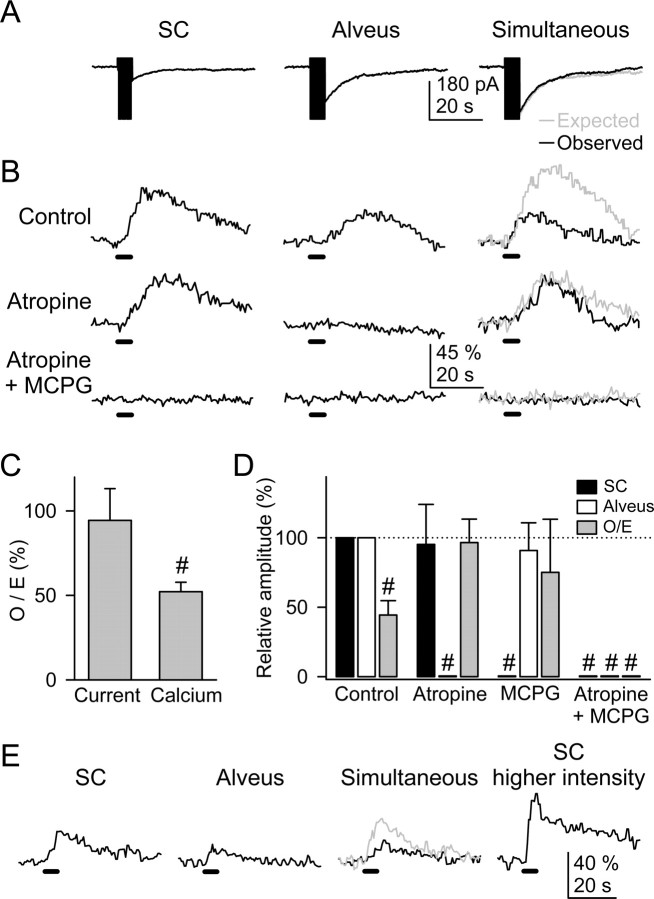
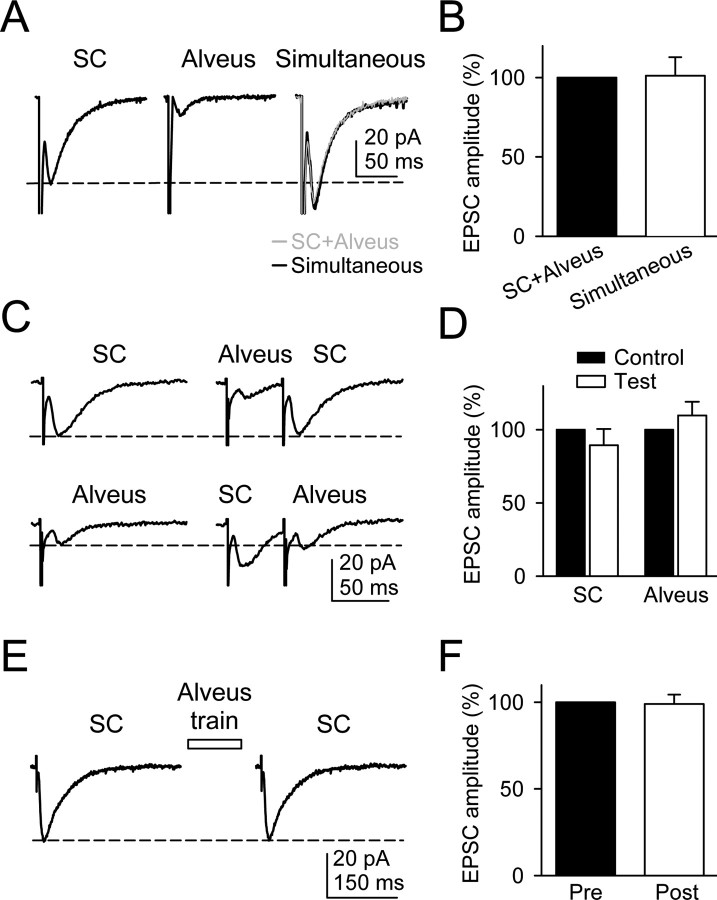
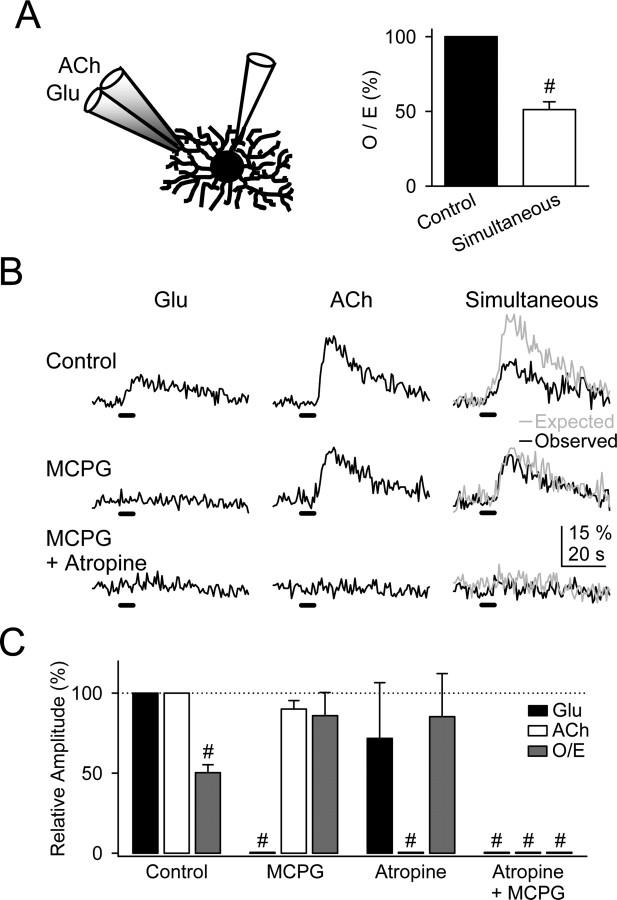
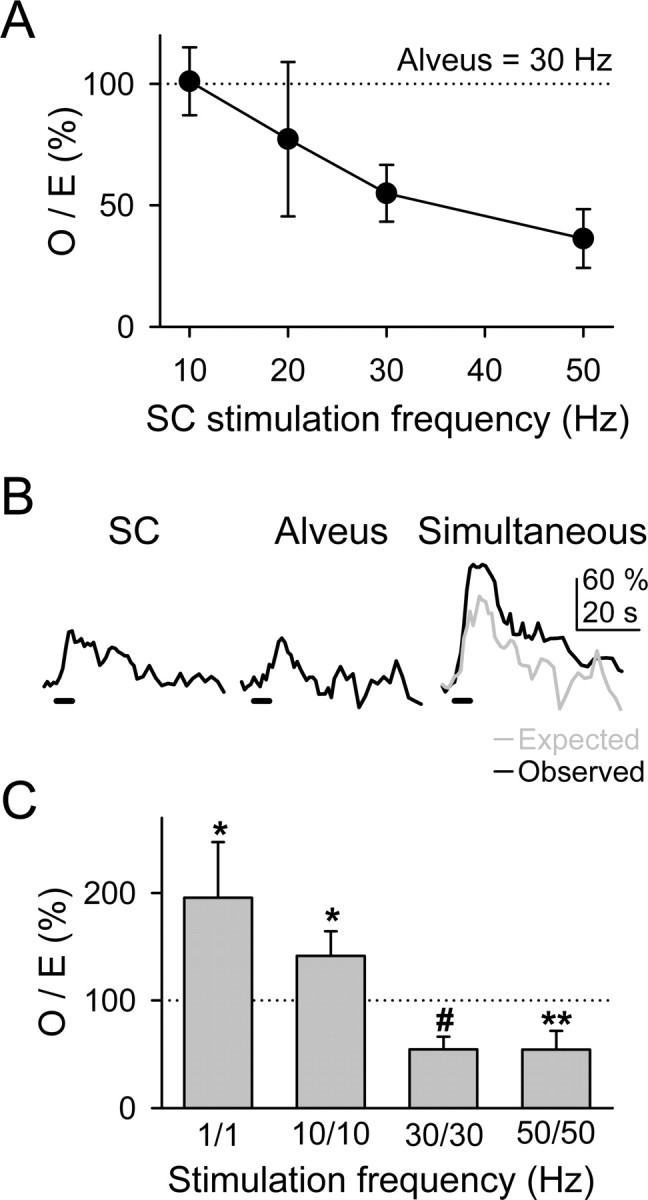
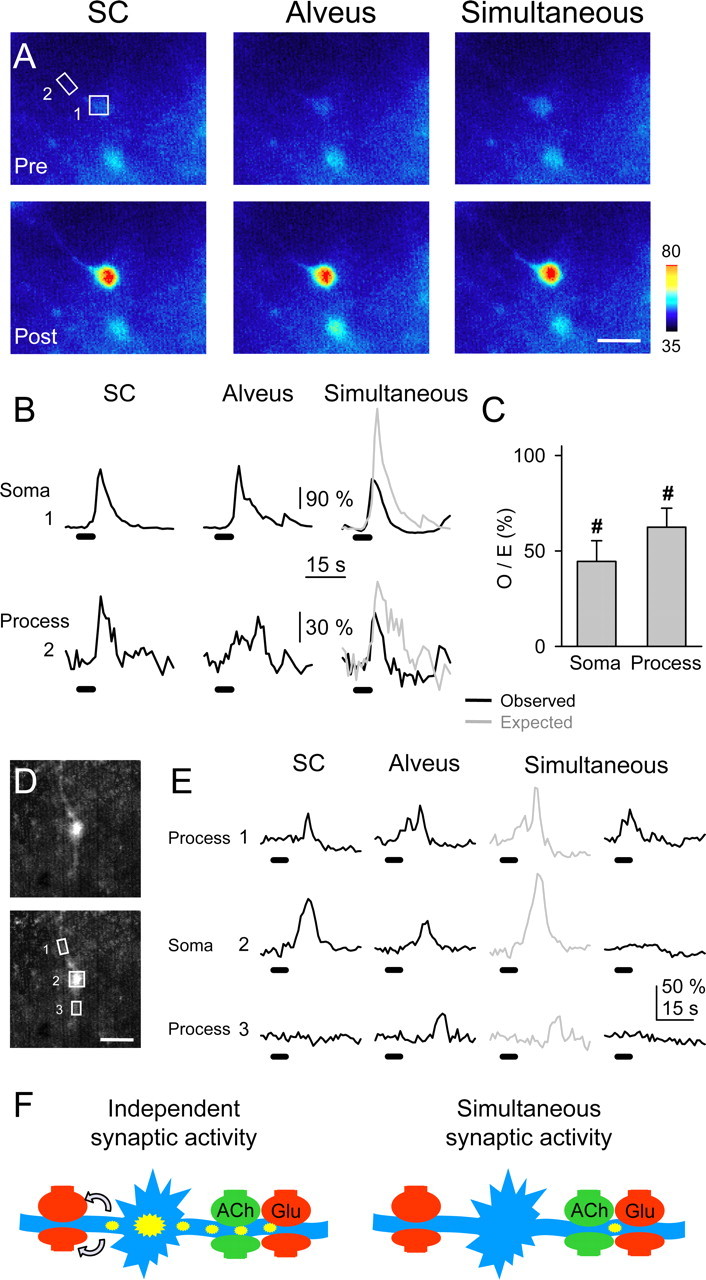
The synaptic control of the astrocytic intracellular Ca2+ is crucial in the reciprocal astrocyte-neuron communication. Using electrophysiological and Ca2+ imaging techniques in rat hippocampal slices, we investigated the astrocytic Ca2+ signal modulation induced by synaptic terminals that use glutamate and acetylcholine. Ca2+ elevations were evoked by glutamate released from Schaffer collaterals and by acetylcholine, but not glutamate, released by alveus stimulation, indicating that astrocytes discriminate the activity of different synapses belonging to different axon pathways. The Ca2+ signal was modulated bidirectionally by simultaneous activation of both pathways, being depressed at high stimulation frequencies and enhanced at low frequencies. The Ca2+ modulation was attributable to astrocytic intrinsic properties, occurred at discrete regions of the processes, and controlled the intracellular expansion of the Ca2+ signal. In turn, astrocyte Ca2+ signal elicited NMDA receptor-mediated currents in pyramidal neurons. Therefore, because astrocytes discriminate and integrate synaptic information, we propose that they can be considered as cellular elements involved in the information processing by the nervous system.


Figures

Figure 6.
Figure 6.
Ca2+ elevations in astrocytes evoked NMDAR-mediated SICs in pyramidal neurons. A, Infrared differential interference contrast image. Note the recording pipettes to the right of the astrocyte in the stratum oriens (top) and to the left of the neuron in the pyramidal layer (bottom). Scale bar, 25 μm. B, Representative EPSC and SIC recorded from a CA1 pyramidal neuron. Note their different time courses. C, Mean frequency of a spontaneous SIC recorded for 3-10 min in an Mg2+-free condition (control) and in 1 μm TTX, 10 μm CNQX, 50 μm AP-5, or 2 mm Mg2+ (n ≥ 5 for each bar). D, Representative Ca2+ levels (top traces) and whole-cell currents (bottom traces) simultaneously recorded in astrocytes and neurons, respectively. As in 69.2 ± 4.8% of the cases, the neuronal SIC (expanded in the bottom trace) occurred in parallel with a Ca2+ elevation in an adjacent astrocyte. A concentration of 50 μm AP-5 abolished the SIC but did not affect astrocytic Ca2+ elevations (n=5). E, Representative astrocyte Ca2+ signal and neuronal current obtained from paired whole-cell recordings in controls and after astrocyte stimulation (top horizontal bar) with 180 mV depolarizing pulses (duration, 100-500 ms) delivered every 1 s. The asterisks indicate neuronal SICs. Some SICs have been truncated, and three are expanded in the bottom traces. Note the frequency increase of both astrocyte Ca2+ elevation and neuronal SIC after astrocyte stimulation. F, Mean frequency of astrocytic Ca2+ elevations and neuronal SICs recorded spontaneously (□) or during astrocytic depolarization (▪) in control conditions or in the presence of 20 mm BAPTA in the recording pipette of the astrocyte (n = 6). Significant differences from control values were established by the Student's t test at **p < 0.01 and #p < 0.001. G, Plot of the neuronal SIC amplitude versus the fluorescence amplitude recorded in the soma of the astrocyte (n = 39 from 6 pairs of cells). The fluorescence amplitude was normalized to the highest amplitude for each astrocyte. Only SICs that coincided with Ca2+ elevations were considered. Points were fitted to a linear regression (straight line; r2 = 0.20).
Figure 7.
Figure 7.
ATP-induced Ca2+ elevations in astrocytes evoked NMDAR-mediated SICs in pyramidal neurons. A, Infrared differential interference contrast image and pseudocolor images representing fluorescence intensities of a fluo-3-filled slice before and after ionophoretical application of ATP for 5 s. Note the lower relative fluorescence at the pyramidal layer. S.O, Stratum oriens; S.P, stratum pyramidale. Scale bar, 30 μm. B, Astrocyte Ca2+ levels (top traces) and whole-cell neuronal currents (bottom traces) during ionophoretical application of ATP (horizontal bar) in TTX and without Mg2+ (control and after perfusion with 50 μm AP-5). Inset, Expanded current trace illustrating the multiple NMDAR-mediated SICs. C, Relative number of astrocytes and neurons that showed Ca2+ elevations and SICs, respectively, after application of ATP in controls and after perfusion with AP-5 (n = 35 astrocytes and 5 neurons from 5 slices). Significant differences were established by the Student's t test at #p < 0.001. D, Mean number of neuronal SICs (blue bars) and averaged astrocyte Ca2+ elevations (red circles) versus time (n = 5 slices). Time 0 corresponds to the beginning of the ATP application (5 s).
Figure 1.
Figure 1.
Responses evoked by SC stimulation in hippocampal stratum oriens (SO) astrocytes. A, Schematic drawing of the experimental arrangement showing the position of the stimulating (left) and recording (right) electrodes in the hippocampal slice preparation. B, Infrared differential interference contrast image showing the hippocampal stratum pyramidale (SP) and the recorded astrocyte in the stratum oriens. Note the recording pipette on the right side of the astrocyte. Scale bar, 20 μm. C, Representative astrocytic Ca2+ levels (top trace) and whole-cell membrane currents (bottom trace) elicited by SC stimulation (30 Hz, 5 s). The vertical black bar on the current trace corresponds to the stimulus artifact (as in all other figures). D, E, Astrocyte Ca2+ levels (top traces) and whole-cell membrane currents (bottom traces) evoked by SC stimulation in control conditions and in the presence of 1 μm TTX and 20 μm CNQX plus 50 μm AP-5 plus 0.8 mm MCPG, respectively. F, G, Relative changes from control recordings of the membrane current amplitude and fluorescence intensity, respectively, evoked by SC stimulation in the presence of 100 μm 4-AP (n = 21), 100 μm Cd2+ (n = 6), 1 μm TTX (n = 8), 0.3 mm t-PDC plus 1 mm DHK (n = 8), 20 μm CNQX plus 50 μm AP-5 plus 0.8 mm MCPG (n = 8), and 1 μm thapsigargin (n = 5). Significant differences were established by the Student's t test at *p < 0.05 and #p < 0.001.
Figure 2.
Figure 2.
The astrocyte Ca2+ signal was modulated by the simultaneous activity of alveus and SC synaptic terminals. A, Representative whole-cell currents elicited by independent or simultaneous stimulation of the SC and alveus (30 Hz, 5 s). In a simultaneous stimulation condition, black and gray traces correspond to the observed and expected responses (i.e., the summation of responses evoked by independent stimulation of both pathways), respectively, as in all other figures. B, Astrocyte Ca2+ levels evoked by independent or simultaneous stimulation of the SC and alveus in control conditions, in the presence of 50 μm atropine, and after the addition of 0.8 mm MCPG. Horizontal lines at the bottom of each trace represent the stimuli, as in all other figures. C, Ratio between observed and expected responses. D, Relative amplitude of the astrocytic Ca2+ elevations evoked by independent or simultaneous stimulation of the SC and alveus in controls and in the presence of 50 μm atropine and 0.8 mm MCPG. The responses evoked by simultaneous stimulation were quantified from the O/E ratio (i.e., the ratio between the observed response evoked by simultaneous stimulation and the expected response: the summation of the responses evoked by independent stimulation) (see Results). n ≥ 5 for each bar. E, Representative example of Ca2+ elevations evoked by the SC, alveus, simultaneous stimulation at a constant intensity, and after increasing the SC stimulation intensity. Note that the Ca2+ elevation elicited by SC stimulation at a stronger intensity was higher than the expected Ca2+ increase under simultaneous stimulation (gray trace). Significant differences were established by the Student's t test at #p < 0.001.
Figure 3.
Figure 3.
EPSCs evoked by SC and alveus stimulation were unaffected by the activity of either pathway. A, Mean EPSCs (n = 20) elicited by the SC, alveus, and simultaneous stimulation of both pathways. B, Averaged EPSC amplitudes evoked by simultaneous stimulation of the SC and alveus relative to the linear summation of EPSCs evoked independently (SC plus alveus) (n = 5 neurons). C, Mean EPSCs (n = 20) evoked by the SC and alveus (top and bottom traces, respectively) in controls and after alveus or SC stimulation, respectively. D, Averaged relative EPSC amplitudes evoked by the SC and alveus in controls and after stimulation of the alveus and SC (Test), respectively (n = 5 cells). E, Mean SC-evoked EPSCs (n = 20) before and after stimulation of the alveus with a single train (30 Hz, 5 s). F, Averaged relative SC-evoked EPSC amplitudes before (Pre) and after (Post) alveus stimulation (n = 8 neurons).
Figure 4.
Figure 4.
Ca2+ signal modulation depended on astrocytic intrinsic properties. A, Schematic drawing showing an astrocyte whole cell filled with fluo-3 and a double-barreled pipette filled with ACh and Glu and Ca2+ elevations evoked by simultaneous application of Glu and ACh relative to the linear summation of responses elicited independently (control) (n = 15). B, Astrocytic Ca2+ levels evoked by independent or simultaneous ionophoresis of Glu and ACh in controls, in 0.8 mm MCPG, and after the addition of 50 μm atropine. C, Relative amplitude of the Ca2+ elevations evoked by ionophoresis of Glu and ACh in control conditions and in 0.8 mm MCPG, 50 μm atropine, or both. Responses evoked by simultaneous stimulation were quantified from the O/E ratio (see Results). n ≥ 5 for each bar. Significant differences were established by the Student's t test at #p < 0.001.
Figure 5.
Figure 5.
Modulation of the astrocytic Ca2+ signal depended on the synaptic activity level. A, Plot of the O/E ratio versus the SC stimulation frequency. Observed and expected Ca2+ elevations corresponded with the simultaneous responses and with the linear summation of the independent responses, respectively, evoked by stimulation of the alveus at 30 Hz and of the SC at variable frequencies (n ≥ 9 for each value). B, Ca2+ elevations evoked by independent or simultaneous stimulation of the SC and alveus with trains of stimuli at 10 Hz for 5 s. C, O/E ratio obtained by varying concurrently the stimulation frequencies of the SC and alveus at 1, 10, 30 and 50 Hz (n ≥ 10 for each bar). Significant differences from control values were established by the Student's t test at *p < 0.05, **p < 0.01, and #p < 0.001.
Figure 8.
Figure 8.
Astrocytic subcellular regions exhibited synaptic-mediated Ca2+ modulation. A, Pseudocolor images representing fluorescence intensities of a fluo-3-filled astrocyte before (Pre) and 10 s after (Post) independent or simultaneous stimulation of the SC and alveus (30 Hz, 5 s). Scale bar, 15 μm. B, Fluorescence intensity changes in the astrocytic soma and a restricted region of the astrocytic process marked with boxes 1 and 2, respectively, in A. C, Ratio between observed and expected Ca2+ elevations in the soma (n = 14) and restricted regions at the processes (n = 24). Significant differences from control values were established by the Student's t test at #p < 0.001.D, Fluorescent images of a fluo-3-filled astrocyte. Scale bar, 15 μm. E, Fluorescence intensity changes in restricted regions of two astrocytic processes (1 and 3) and soma (2) marked with boxes in D, evoked by independent or simultaneous stimulation of the SC and alveus (30 Hz, 5 s). Note that after alveus stimulation, Ca2+ increased in region 1 and later propagated with delay to regions 2 and 3. After simultaneous stimulation, Ca2+ increased in region 1 but failed to propagate to regions 2 and 3. F, Schematic drawing representing a hypothetical consequence of the Ca2+ signal modulation. Under independent high-frequency synaptic activity of either pathway (left), astrocyte Ca2+ elevations initiate in specific processes and then propagate to the soma and other processes, eventually leading to long-distance neuromodulation by Ca2+-dependent release of glutamate (arrows). However, simultaneous high-frequency synaptic activity prevents the intracellular propagation of the astrocyte Ca2+ signal and its long-distance neuromodulatory effects.

Similar articles

Cited by

References

    1. Aguado F, Espinosa-Parrilla JF, Carmona MA, Soriano E (2002) Neuronal activity regulates correlated network properties of spontaneous calcium transients in astrocytes in situ. J Neurosci 22: 9430-9444. - PMC - PubMed
    1. Angulo MC, Kozlov AS, Charpak S, Audinat E (2004) Glutamate released from glial cells synchronizes neuronal activity in the hippocampus. J Neurosci 24: 6920-6927. - PMC - PubMed
    1. Araque A, Parpura V, Sanzgiri RP, Haydon PG (1998a) Glutamate-dependent astrocyte modulation of synaptic transmission between cultured hippocampal neurons. Eur J Neurosci 10: 2129-2142. - PubMed
    1. Araque A, Sanzgiri RP, Parpura V, Haydon PG (1998b) Calcium elevation in astrocytes causes an NMDA receptor-dependent increase in the frequency of miniature synaptic currents in cultured hippocampal neurons. J Neurosci 18: 6822-6829. - PMC - PubMed
    1. Araque A, Parpura V, Sanzgiri RP, Haydon PG (1999) Tripartite synapses: glia, the unacknowledged partner. Trends Neurosci 22: 208-215. - PubMed

Publication types

MeSH terms

LinkOut - more resources