Comparative Study
. 2005 Mar 2;25(9):2312-21.
doi: 10.1523/JNEUROSCI.4795-04.2005.

Spike-frequency adaptation separates transient communication signals from background oscillations

Affiliations
Comparative Study

Spike-frequency adaptation separates transient communication signals from background oscillations

Jan Benda et al. J Neurosci. .

Abstract

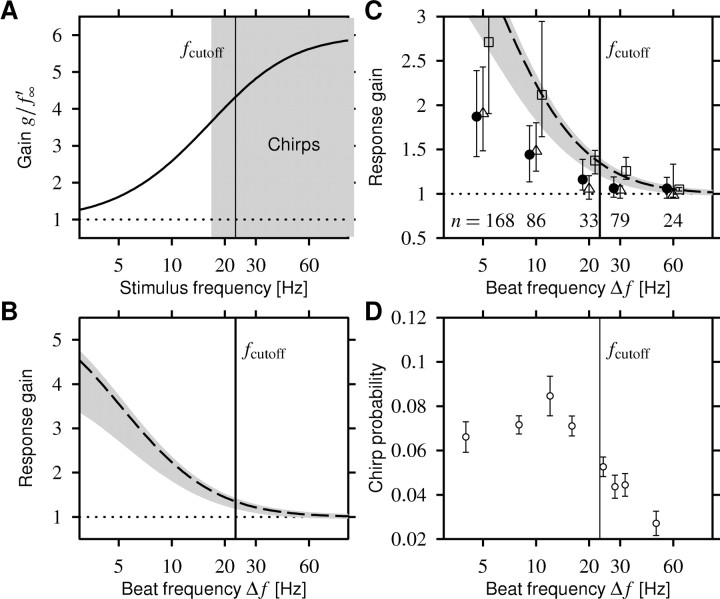
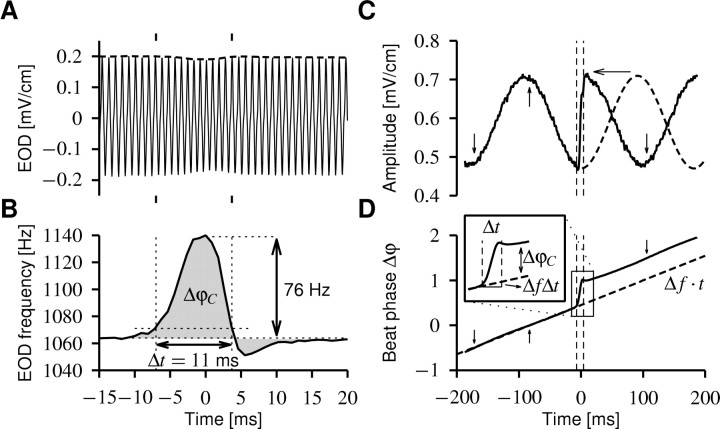
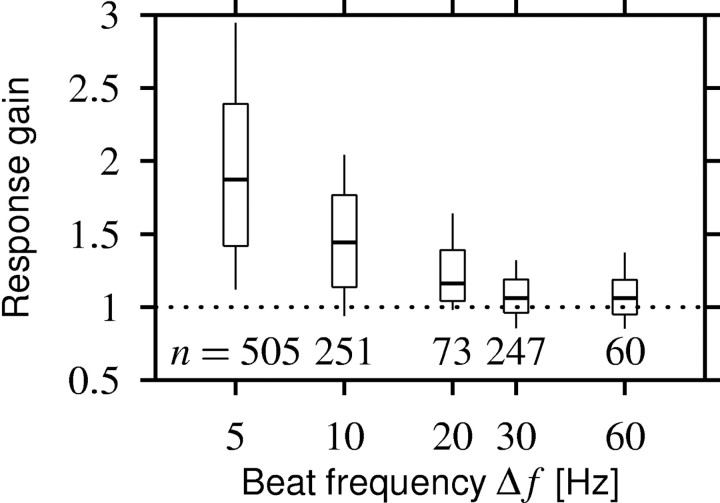
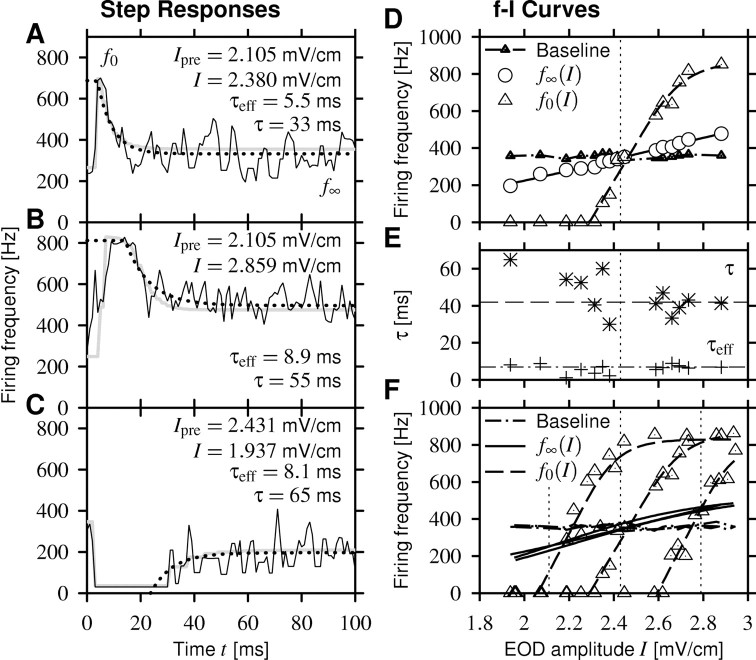
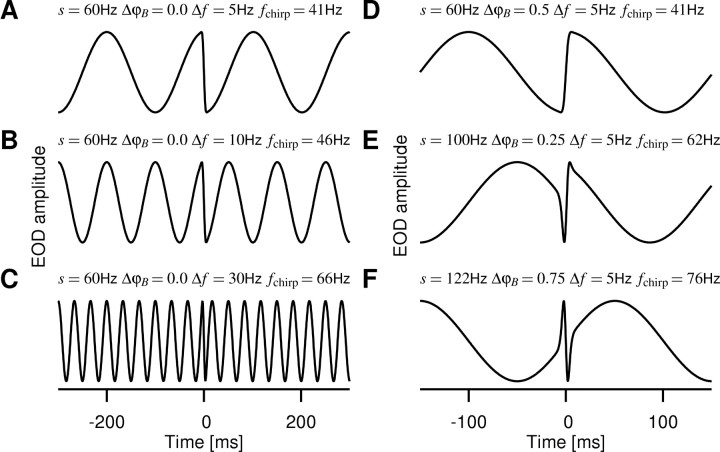
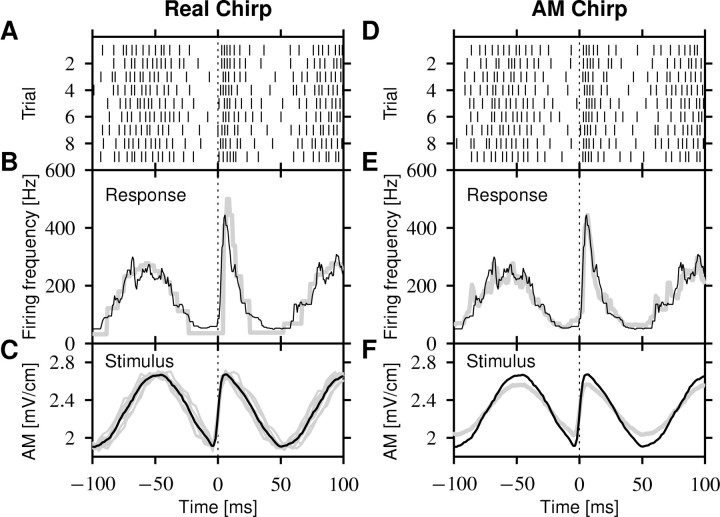
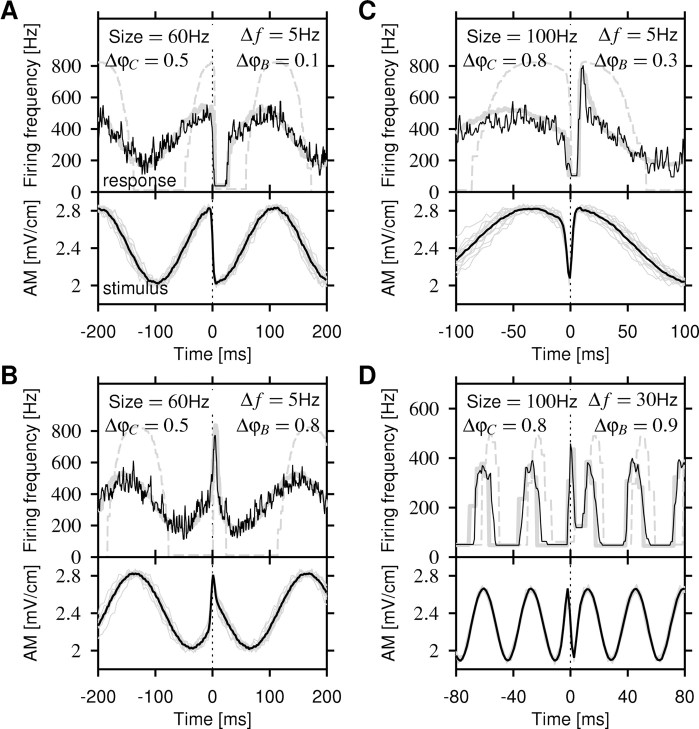
Spike-frequency adaptation is a prominent feature of many neurons. However, little is known about its computational role in processing behaviorally relevant natural stimuli beyond filtering out slow changes in stimulus intensity. Here, we present a more complex example in which we demonstrate how spike-frequency adaptation plays a key role in separating transient signals from slower oscillatory signals. We recorded in vivo from very rapidly adapting electroreceptor afferents of the weakly electric fish Apteronotus leptorhynchus. The firing-frequency response of electroreceptors to fast communication stimuli ("small chirps") is strongly enhanced compared with the response to slower oscillations ("beats") arising from interactions of same-sex conspecifics. We are able to accurately predict the electroreceptor afferent response to chirps and beats, using a recently proposed general model for spike-frequency adaptation. The parameters of the model are determined for each neuron individually from the responses to step stimuli. We conclude that the dynamics of the rapid spike-frequency adaptation is sufficient to explain the data. Analysis of additional data from step responses demonstrates that spike-frequency adaptation acts subtractively rather than divisively as expected from depressing synapses. Therefore, the adaptation dynamics is linear and creates a high-pass filter with a cutoff frequency of 23 Hz that separates fast signals from slower changes in input. A similar critical frequency is seen in behavioral data on the probability of a fish emitting chirps as a function of beat frequency. These results demonstrate how spike-frequency adaptation in general can facilitate extraction of signals of different time scales, specifically high-frequency signals embedded in slower oscillations.


Figures

Figure 7.
Figure 7.
Comparison of the response-gain data with model predictions and behavior. A, The gain Equation 3 of the high-pass filter generated by adaptation (solid line) as a function of stimulus frequency. The averaged value of the measured effective adaptation time constants sets the cutoff frequency fcutoff of the gain function to 23 Hz (vertical line in all panels). Chirps are high-frequency signals (gray area) that are transmitted with a high gain. B, The response gain Equation 6 as a function of positive beat frequencies Δf estimated from the high-pass filter shown in A. The dashed line is the response gain for 14-ms-wide chirps that generate a phase shift of 1, and the gray area is for phase shifts ranging from 0.25 to 1.5. C, The response gain from B (dashed line and gray area) explains the decay of the observed response gain only qualitatively (filled circles; median with 2nd and 3rd quartiles). For the 18 cells in which f-I curves were measured, we computed the response gains as predicted by the models. Using the adaptation model Equation 1, thus taking the saturating f-I curves into account, does not improve the match (squares). However, the additional low-pass filter properties introduced by spikes, modeled using the perfect integrator Equation 4, reduce the predicted response gains significantly (triangles), resulting in a much better match to the actually observed data. The variability of the response-gain data can be mainly attributed to the different sized chirps (compare error bars to the width of the gray area). D, The probability of a male fish emitting chirps as a function of beat frequency as reported by Bastian et al. (2001), their Fig. 3A.
Figure 1.
Figure 1.
Chirps. A, Looking at the EOD waveform (solid line), a small chirp (within the tic marks) is only visible as a small decrease in EOD amplitude (dashed line). This trace was recorded from the head-tail electrodes that do not pick up an additional stimulus field. B, Plotting the frequency of the EOD reveals the chirp, a transient (Δt = 11 ms) increase in EOD frequency (76 Hz) followed sometimes by a much smaller decrease in EOD frequency. This frequency excursion results in a phase shift ΔφC relative to an EOD without a chirp, which is given by the integral over the EOD frequency minus its baseline frequency (gray area). ΔφC is always positive, because a chirp always increases the EOD frequency. C, The presence of an EOD of a second fish creates a beat; here, with frequency Δf = 5 Hz. The chirp (with in the vertical dashed lines) has a huge impact on the beat pattern (envelope of the EOD, solid line). One-half of a cycle of the beat (dashed line) is compressed (horizontal arrow) within the chirp, thus resulting in a phase shift of the beat. The same chirp as in A is shown but recorded from the transdermal electrodes while applying an artificial EOD on the stimulus electrodes mimicking a second fish. D, The phase Δφ of the beat determines the position of peaks (upward arrow) and troughs (downward arrows) of the beat. Δφ is the difference between the phases of the two EODs. In the absence of chirps, the phases of the EODs φ1 = f1t and φ2 = f2t are determined by their respective frequencies, f1 and f2, and thus the phase of the beat is linearly increasing in time (dashed line; Δφ = φ2 - φ1ft), as determined by the beat frequency Δf = f2 - f1. A chirp leads to a sudden increase in the phase of the beat (solid line), because the phase shift ΔφC of the chirp is added to the phase shift of the beat ΔfΔt and thus accelerates the beat pattern for the duration Δt of the chirp. This is demonstrated by the inset that shows enlarged the time course of the beat phase during the chirp. Note also that the phase increase during the chirp is in good approximation linear.
Figure 5.
Figure 5.
Response gain as a function of beat frequency Δf for all 1208 chirp responses measured. The horizontal line within the boxes represents the median, the box includes the 2nd and 3rd quartiles, and the ends of the vertical lines mark the 1st and 9th deciles. Chirps evoke a response that is larger than the response to the beat (response gain >1) if the beat frequency is smaller than ∼30 Hz.
Figure 6.
Figure 6.
Firing frequency-intensity curves (f-I curves) measured in the same cell as in Figure 4A-C. First, the cell was adapted to some EOD amplitude Ipre higher, lower, or equal to the EOD baseline amplitude (2.43 mV/cm) to prepare the cell in different states of adaptation. Then the stimulus was stepped to various amplitudes I at time t = 0. Three examples of the firing-frequency response to the second part of the stimulus are shown in A-C (black solid lines). An exponential fit (dotted line; clipped at the maximum response) measured the effective time constant of adaptation τeff, and a fit of the computed response of the adaptation model Equations 1 and 4 (gray line) yields the adaptation time constant τ. Note that fitting an exponential to the step responses describes the data sufficiently well but, in contrast to the adaptation model Equation 1, does not define a dynamics for arbitrary stimuli. A, Stimulus amplitudes I larger than Ipre evoke a strong onset response f0, which rapidly adapts down to a steady-state value f slightly above baseline activity (357 Hz). B, For very large intensities, the response saturates at the EOD frequency.C, Decreasing the EOD amplitude may even cause cessation of firing. After a while, the cell recovers from adaptation and starts firing again, leveling out below the baseline activity. D, Onset f-I curve f0(I) (triangles) and steady-state f-I curve f(I) (circles) constructed from onset and steady-state responses for a particular preadaptation stimulus Ipre (here the EOD baseline amplitude; vertical dotted line). Fitting Boltzmann functions to both f-I curves describes the data reasonably well (solid and dashed lines; see Materials and Methods). The baseline firing frequency (triangles) as the response to the fish's own EOD was measured during 100 ms before applying the preadapting stimulus. E, The effective time constant τeff (+) and the adaptation time constant τ (*) obtained from the measurement shown in D are independent of stimulus intensity I. The averaged time constants from all 18 cells are τeff = 7 ms (dashed dotted line) and τ = 42 ms (dashed line). F, Comparison of f-I curves measured for three values of Ipre (vertical dotted lines) of the preadaptation stimulus and thus three different states of adaptation. By definition, the steady-state f-I curves (solid lines) and the baseline firing frequencies (dashed dotted line) are independent of Ipre. In contrast, the onset f-I curves (triangles, data; dashed lines, fit) are shifted by adaptation along the intensity axis while keeping their shape.
Figure 2.
Figure 2.
Stimuli generated by chirps. EOD AMs resulting from Δt = 14-ms-wide chirps of different peak frequency increases (size s of the chirp) centered around time 0 on various positions ΔφB with in the beat of frequency Δf, as indicated, are shown. The traces were generated assuming a Gaussian frequency increase in the EOD during the chirp according to A(t) = cos(2πΔφ(t)), where formula image is the phase of the beat as the time integral of the frequency difference of the two EODs and formula image. These artificial EOD AMs are very similar to AMs resulting from real chirps [compare with Zupanc and Maler (1993) and Fig. 1C]. fchirp is an estimate of the stimulus frequency during the chirp as given in Equation 5. A-C, A 60 Hz chirp advancing the beat by one-half of a cycle (ΔφC = 0.5) on different beat frequencies, Δf = 5, 10, and 30 Hz. The chirp is located at the peak of the beat and thus produces a sudden downstroke in EOD amplitude, which, however, is less salient at high beat frequencies (C). D, Same chirp as in A but one-half of a cycle later in the beat, therefore starting in the trough of the beat and producing an upstroke. E, A 100 Hz chirp advancing the beat by ΔφC = 0.8 cycles at the zero-crossing of the beat-sine wave. F, After a 122 Hz chirp (ΔφC = 1), the beat continues without a phase shift. The fish emit chirps on every position within the beat (data not shown).
Figure 3.
Figure 3.
P-unit response to a chirp. The example shows a 60 Hz chirp at the trough of a Δf = 10 Hz beat. A, The spike trains evoked by the presentation of nine chirps at approximately the same beat position of a cell with p = 0.16 (141 Hz baseline firing rate divided by 881 Hz EOD frequency). B, The firing frequency computed as the averaged inverse ISI from the spikes in A (solid line). The gray line is the prediction of the spike-frequency adaptation model Equations 1 and 4. C, The relevant stimulus for the P-unit is the AM of the transdermal EOD. The gray lines are the individual realizations for each of the spike trains in A. The black line is the average stimulus. D-F, Each EOD AM in C was recorded and subsequently presented as a pure AM to confirm that the AM generated by the chirp is the only feature that is encoded by the P-units. D, The spike trains evoked by the AM stimuli. E, The corresponding firing frequency (gray line) is almost identical to the firing-frequency response to the real chirps (black line; same as in B). F, The averaged stimulus for the AMs (gray line) and the real chirps (black line; same as in B) differ in modulation depth because of the asymmetric EOD waveform (see Materials and Methods).
Figure 4.
Figure 4.
Firing-frequency responses (top panels; black line) to various-sized chirps generating a phase shift, ΔφC, on a beat with frequency Δf at beat position ΔφB as indicated. A-C, Recordings from a single P-unit with p = 0.42 (baseline firing rate, 346 Hz; EOD frequency, 826 Hz) are shown. The corresponding AMs of the transdermal EOD are shown in the bottom panels (individual stimuli, gray; averaged stimulus, black). The model prediction (top panels; gray solid line) closely follows the measured firing frequency (black line), whereas the prediction with the onset f-I curve alone does not describe the data (dashed gray line). A, A 60 Hz chirp occurring around the top of a 5 Hz beat generates a fast downstroke in EOD amplitude. This causes the neuron to entirely stop spiking. In contrast, the neuron still fires at the troughs of the beat. Note that the firing frequency cannot equal zero, because it is measured as the inverse ISI. Periods of silence appear as straight horizontal lines. B, Chirps at around the trough of the beat generate fast upstrokes, causing a much stronger response than the one during beat peaks. C, A larger 100 Hz chirp produces a downstroke immediately followed by an upstroke. This results in a short pause followed by a strong peak in the firing-frequency response. Note the enlarged time axis. D, A 100 Hz chirp on a faster 30 Hz beat recorded from a different unit (same unit as in Fig. 3). The response to the beat is almost as large as the response to the chirp.

Similar articles

Cited by

References

    1. Abbott LF, Varela JA, Sen K, Nelson SB (1997) Synaptic depression and cortical gain control. Science 275: 221-224. - PubMed
    1. Baccus SA, Meister M (2002) Fast and slow contrast adaptation in retinal circuitry. Neuron 36: 909-919. - PubMed
    1. Bastian J (1981) Electrolocation. I. How electroreceptors of Apteronotus albifrons code for moving objects and other electrical stimuli. J Comp Physiol [A] 144: 465-479.
    1. Bastian J, Schniederjan S, Nguyenkim J (2001) Arginine vasotocin modulates a sexually dimorphic communication behavior in the weakly electric fish Apteronotus leptorhynchus J Exp Biol 204: 1909-1923. - PubMed
    1. Benda J, Herz AVM (2003) A universal model for spike-frequency adaptation. Neural Comput 15: 2523-2564. - PubMed

Publication types

MeSH terms

LinkOut - more resources