

Noradrenaline and dopamine elevations in the rat prefrontal cortex in spatial working memory
- PMID: 15745958
- PMCID: PMC6726105
- DOI: 10.1523/JNEUROSCI.3038-04.2005
Noradrenaline and dopamine elevations in the rat prefrontal cortex in spatial working memory
Abstract
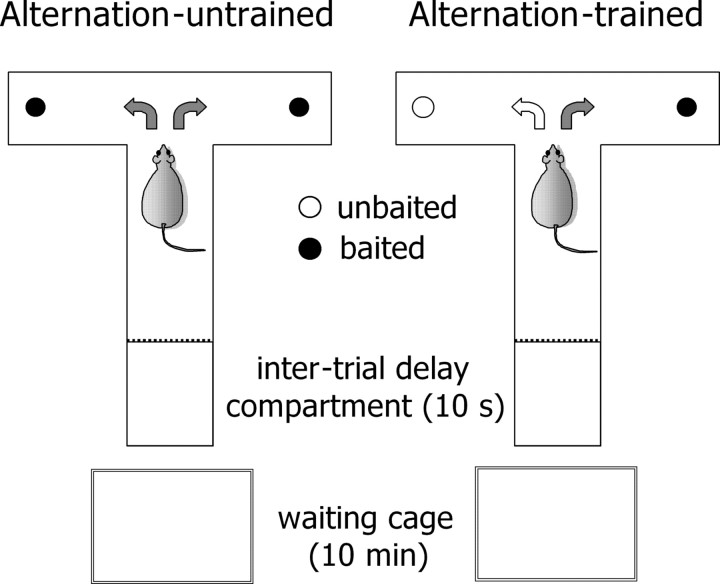
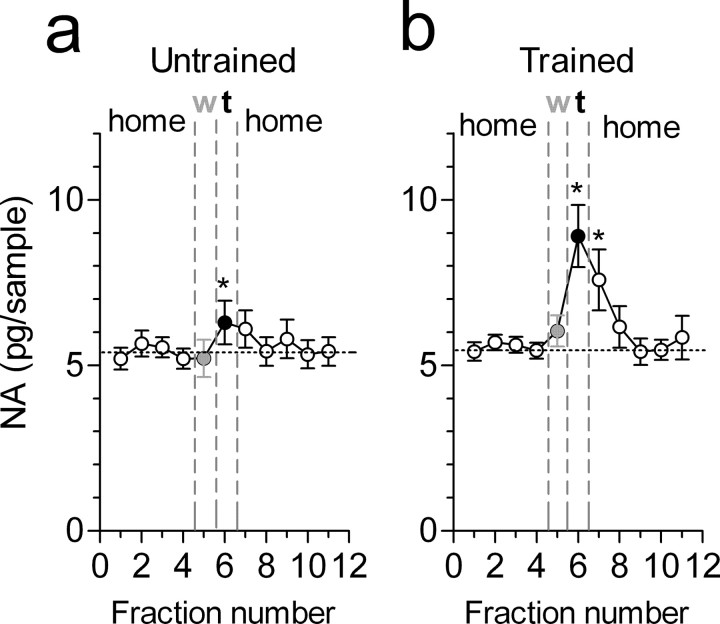
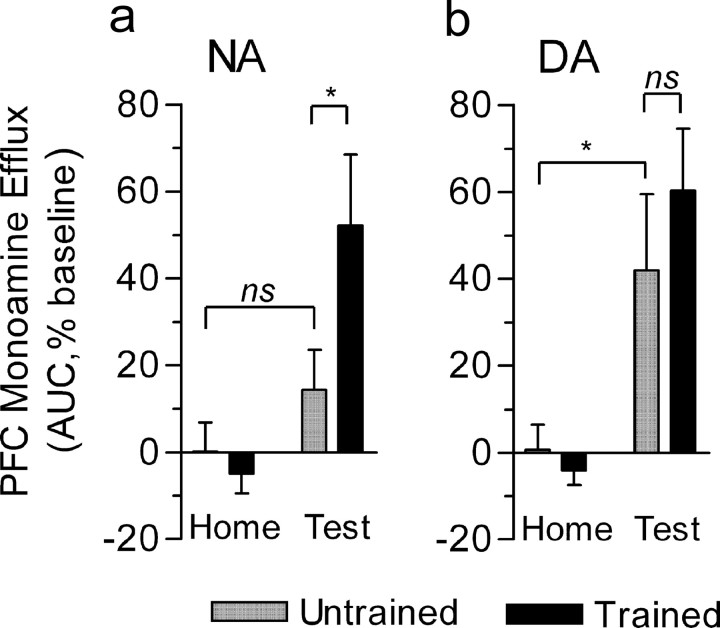
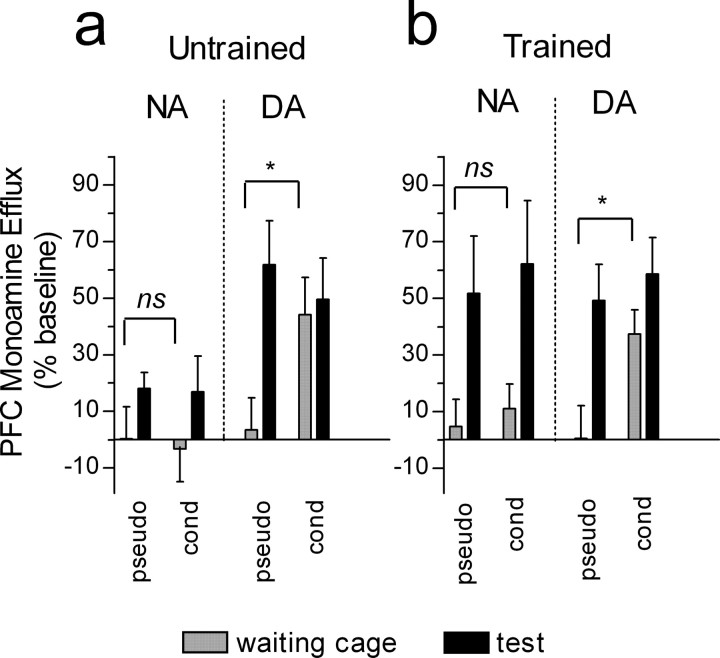
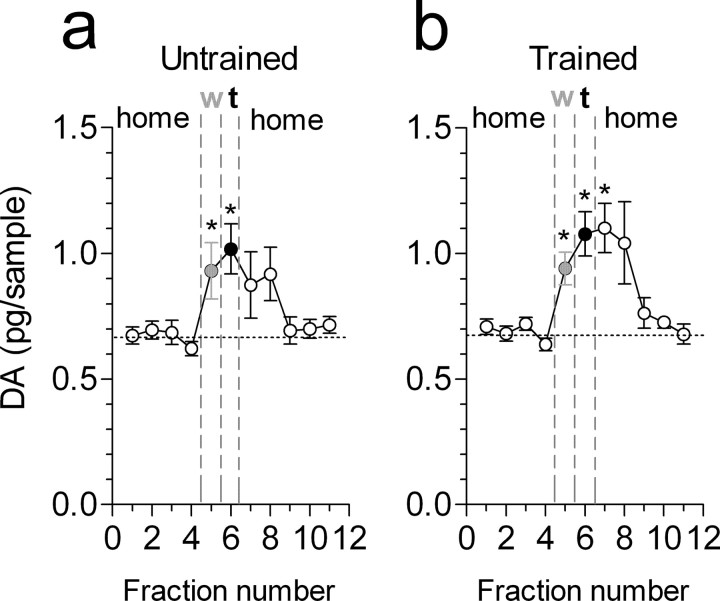
The role of prefrontal cortical dopamine (DA) in the modulation of working memory functions is well documented, but substantial evidence indicates that the locus ceruleus noradrenergic system also modulates working memory via actions within the prefrontal cortex (PFC). This study shows that PFC noradrenaline (NA) and DA dialysate levels phasically increase when rats perform correctly in a delayed alternation task in a T-maze, a test of spatial working memory. However, NA levels were markedly enhanced in animals trained to alternate compared with rats that acquired the spatial information about the location of food in the maze but were untrained to make a choice to obtain the reward. In contrast, PFC DA elevations occurred independently of whether the animal had acquired the trial-specific information for correct task execution. The contribution of anticipatory responses to catecholamine efflux was also evaluated by exposing rats to an environment signaling the presence of the reward in the successive alternation task. No conditioned NA efflux was observed in either group. In contrast, in both groups, DA efflux increased in the anticipatory phase of the test to the same levels of those reached during the task. These data provide the first direct evidence for a selective activation of PFC NA transmission during a spatial working memory task. We propose that, in the working memory task, DA is primarily associated with reward expectancy, whereas NA is involved in the active maintenance of the information about a goal and the rules to achieve it.
Figures
Similar articles
-
D1 receptor modulation of hippocampal-prefrontal cortical circuits integrating spatial memory with executive functions in the rat.J Neurosci. 1998 Feb 15;18(4):1613-21. doi: 10.1523/JNEUROSCI.18-04-01613.1998. J Neurosci. 1998. PMID: 9454866 Free PMC article.
-
Age-related spatial working memory impairment is caused by prefrontal cortical dopaminergic dysfunction in rats.Neuroscience. 2009 Sep 15;162(4):1192-201. doi: 10.1016/j.neuroscience.2009.05.023. Epub 2009 May 20. Neuroscience. 2009. PMID: 19463906
-
Supranormal stimulation of D1 dopamine receptors in the rodent prefrontal cortex impairs spatial working memory performance.J Neurosci. 1997 Nov 1;17(21):8528-35. doi: 10.1523/JNEUROSCI.17-21-08528.1997. J Neurosci. 1997. PMID: 9334425 Free PMC article.
-
Mesocortical dopamine modulation of executive functions: beyond working memory.Psychopharmacology (Berl). 2006 Nov;188(4):567-85. doi: 10.1007/s00213-006-0404-5. Epub 2006 May 3. Psychopharmacology (Berl). 2006. PMID: 16670842 Review.
-
The role of prefrontal catecholamines in attention and working memory.Front Neural Circuits. 2014 Apr 8;8:33. doi: 10.3389/fncir.2014.00033. eCollection 2014. Front Neural Circuits. 2014. PMID: 24782714 Free PMC article. Review.
Cited by
-
New therapeutic strategies targeting D1-type dopamine receptors for neuropsychiatric disease.Front Biol (Beijing). 2015 Jun;10(3):230-238. doi: 10.1007/s11515-015-1360-4. Epub 2015 May 13. Front Biol (Beijing). 2015. PMID: 28280503 Free PMC article.
-
Prefrontal/accumbal catecholamine system processes high motivational salience.Front Behav Neurosci. 2012 Jun 27;6:31. doi: 10.3389/fnbeh.2012.00031. eCollection 2012. Front Behav Neurosci. 2012. PMID: 22754514 Free PMC article.
-
The homotopic connectivity of the functional brain: a meta-analytic approach.Sci Rep. 2019 Mar 4;9(1):3346. doi: 10.1038/s41598-019-40188-3. Sci Rep. 2019. PMID: 30833662 Free PMC article.
-
Norepinephrine versus dopamine and their interaction in modulating synaptic function in the prefrontal cortex.Brain Res. 2016 Jun 15;1641(Pt B):217-33. doi: 10.1016/j.brainres.2016.01.005. Epub 2016 Jan 11. Brain Res. 2016. PMID: 26790349 Free PMC article. Review.
-
A neurochemical yin and yang: does serotonin activate and norepinephrine deactivate the prefrontal cortex?Psychopharmacology (Berl). 2011 Feb;213(2-3):171-82. doi: 10.1007/s00213-010-1856-1. Epub 2010 Apr 13. Psychopharmacology (Berl). 2011. PMID: 20386882 Review.
References
-
- Arnsten AF (1997) Catecholamine regulation of the prefrontal cortex. J Psychopharmacol 11: 151-162. - PubMed
-
- Arnsten AF (2001) Modulation of prefrontal cortical-striatal circuits: relevance to therapeutic treatments for Tourette syndrome and attention-deficit hyperactivity disorder. Adv Neurol 85: 333-341. - PubMed
-
- Arnsten AF, Goldman-Rakic P (1984) Selective prefrontal cortical projections to the region of the locus coeruleus and raphe nucleus in the rhesus monkey. Brain Res 306: 9-18. - PubMed
-
- Arnsten AF, Goldman-Rakic P (1985) Alpha-2 adrenergic mechanisms in prefrontal cortex associated with cognitive decline in aged non-human primates. Science 230: 1273-1276. - PubMed
Publication types
MeSH terms
Substances
LinkOut - more resources
Full Text Sources
Miscellaneous