

Calcium-stimulated adenylyl cyclases modulate ethanol-induced neurodegeneration in the neonatal brain
- PMID: 15745964
- PMCID: PMC6726108
- DOI: 10.1523/JNEUROSCI.4940-04.2005
Calcium-stimulated adenylyl cyclases modulate ethanol-induced neurodegeneration in the neonatal brain
Abstract
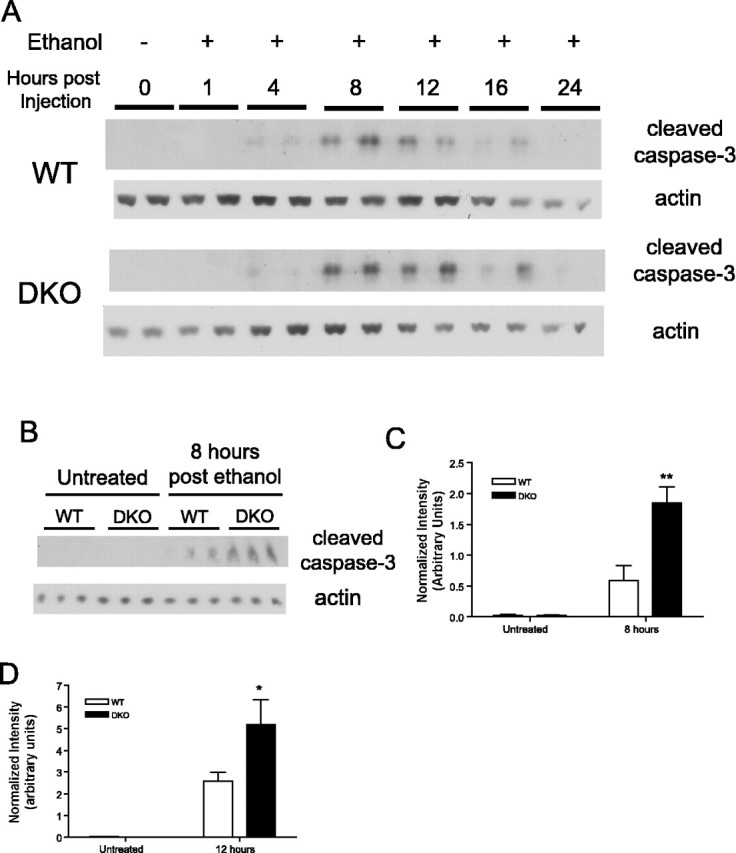
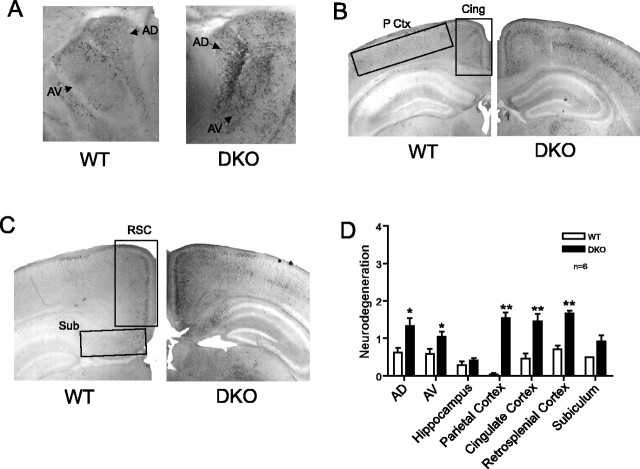
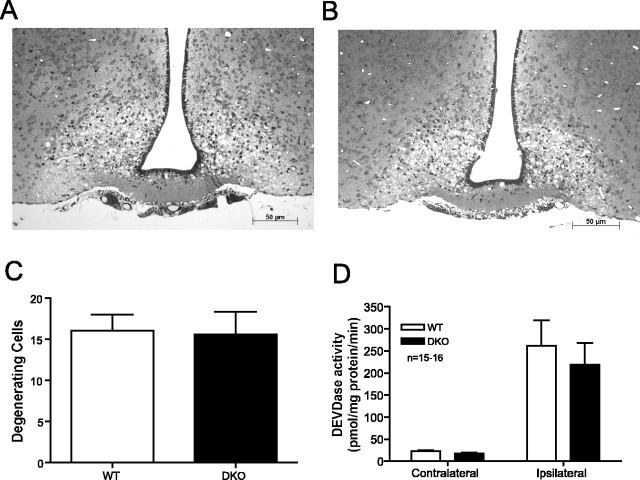
Fetal alcohol exposure results in cognitive and neurobehavioral deficits, but the effects of modifying genetic loci on the severity of these sequelas have not been well characterized. Although the cAMP signaling pathway has been shown to be an important modulator of ethanol sensitivity in adult mice, its potential role in modulating ethanol-induced neurodegeneration has not been examined. Adenylyl cyclases (ACs) 1 and 8 produce cAMP in response to intracellular calcium elevation and modulate several aspects of neuronal function, including ethanol sensitivity. AC1 and AC8 are expressed widely throughout the brain of neonatal mice, and genetic deletion of both AC1 and AC8 in double-knock-out (DKO) mice enhances ethanol-induced neurodegeneration in the brains of neonatal mice. In addition, ethanol treatment induces significantly greater levels of caspase-3 activation in the brains of DKO mice compared with wild-type (WT) mice, reflecting higher numbers of apoptotic neurons. Administration of the NMDA receptor antagonist MK801 [(+)-5-methyl-10,11-dihydro-5H-dibenzo [a,d] cyclohepten-5,10-imine hydrogen maleate] or the GABA(A) receptor potentiator phenobarbital, which mimics components of the effects of ethanol on neurons, results in significantly greater neurodegeneration in the brains of neonatal DKO mice than WT mice. Furthermore, loss of a single calcium-stimulated AC isoform potentiates neurodegeneration after administration of ethanol, MK801, or phenobarbital. In contrast, the levels of physiological cell death, death after hypoxia/ischemia, and excitotoxic cell death are not increased in the brains of DKO mice. Thus, AC1 and AC8 are critical modulators of neurodegeneration induced by activity blockade in the neonatal brain and represent genetic loci that may potentially modify the severity of fetal alcohol syndrome.
Figures


Similar articles
-
Calcium-stimulated adenylyl cyclases are critical modulators of neuronal ethanol sensitivity.J Neurosci. 2005 Apr 20;25(16):4118-26. doi: 10.1523/JNEUROSCI.4273-04.2005. J Neurosci. 2005. PMID: 15843614 Free PMC article.
-
Investigation of calcium-stimulated adenylyl cyclases 1 and 8 on toluene and ethanol neurobehavioral actions.Neurotoxicol Teratol. 2012 Sep-Oct;34(5):481-8. doi: 10.1016/j.ntt.2012.06.005. Epub 2012 Jul 10. Neurotoxicol Teratol. 2012. PMID: 22789433
-
A role for calmodulin-stimulated adenylyl cyclases in cocaine sensitization.J Neurosci. 2009 Feb 25;29(8):2393-403. doi: 10.1523/JNEUROSCI.4356-08.2009. J Neurosci. 2009. PMID: 19244515 Free PMC article.
-
Domoic acid-induced neurodegeneration resulting in memory loss is mediated by Ca2+ overload and inhibition of Ca2+ + calmodulin-stimulated adenylate cyclase in rat brain (review).Int J Mol Med. 2000 Oct;6(4):377-89. doi: 10.3892/ijmm.6.4.377. Int J Mol Med. 2000. PMID: 10998428 Review.
-
The role of Ca²⁺-stimulated adenylyl cyclases in bidirectional synaptic plasticity and brain function.Rev Neurosci. 2012;23(1):67-78. doi: 10.1515/revneuro-2011-0063. Rev Neurosci. 2012. PMID: 22718613 Review.
Cited by
-
Ethanol Stimulates Locomotion via a Gαs-Signaling Pathway in IL2 Neurons in Caenorhabditis elegans.Genetics. 2017 Nov;207(3):1023-1039. doi: 10.1534/genetics.117.300119. Epub 2017 Sep 26. Genetics. 2017. PMID: 28951527 Free PMC article.
-
Restoration of neuronal plasticity by a phosphodiesterase type 1 inhibitor in a model of fetal alcohol exposure.J Neurosci. 2006 Jan 18;26(3):1057-60. doi: 10.1523/JNEUROSCI.4177-05.2006. J Neurosci. 2006. PMID: 16421325 Free PMC article.
-
Inheritance and Establishment of Gut Microbiota in Chickens.Front Microbiol. 2017 Oct 10;8:1967. doi: 10.3389/fmicb.2017.01967. eCollection 2017. Front Microbiol. 2017. PMID: 29067020 Free PMC article.
-
Postnatal ethanol exposure simplifies the dendritic morphology of medium spiny neurons independently of adenylyl cyclase 1 and 8 activity in mice.Alcohol Clin Exp Res. 2014 May;38(5):1339-46. doi: 10.1111/acer.12383. Epub 2014 Mar 21. Alcohol Clin Exp Res. 2014. PMID: 24655226 Free PMC article.
-
Dysregulation of TrkB phosphorylation and proBDNF protein in adenylyl cyclase 1 and 8 knockout mice in a model of fetal alcohol spectrum disorder.Alcohol. 2016 Mar;51:25-35. doi: 10.1016/j.alcohol.2015.11.008. Epub 2016 Jan 12. Alcohol. 2016. PMID: 26992697 Free PMC article.
References
-
- Abel EL (1995) An update on incidence of FAS: FAS is not an equal opportunity birth defect. Neurotoxicol Teratol 17: 437-443. - PubMed
-
- Boatright KM, Salvesen GS (2003) Mechanisms of caspase activation. Curr Opin Cell Biol 15: 725-731. - PubMed
-
- Cali JJ, Zwaagstra JC, Mons N, Cooper DM, Krupinski J (1994) Type VIII adenylyl cyclase. A Ca2+/calmodulin-stimulated enzyme expressed in discrete regions of rat brain. J Biol Chem 269: 12190-12195. - PubMed
-
- Carloni S, Mazzoni E, Balduini W (2004) Caspase-3 and calpain activities after acute and repeated ethanol administration during the rat brain growth spurt. J Neurochem 89: 197-203. - PubMed
-
- Chetkovich DM, Sweatt JD (1993) nMDA receptor activation increases cyclic AMP in area CA1 of the hippocampus via calcium/calmodulin stimulation of adenylyl cyclase. J Neurochem 61: 1933-1942. - PubMed
Publication types
MeSH terms
Substances
Grants and funding
LinkOut - more resources
Full Text Sources
Medical
Molecular Biology Databases
Research Materials