Comparative Study
. 2005 May 1;564(Pt 3):877-93.
doi: 10.1113/jphysiol.2005.083741. Epub 2005 Mar 3.

In vivo recordings from rat geniculate ganglia: taste response properties of individual greater superficial petrosal and chorda tympani neurones

Affiliations
Comparative Study

In vivo recordings from rat geniculate ganglia: taste response properties of individual greater superficial petrosal and chorda tympani neurones

Suzanne I Sollars et al. J Physiol. .

Abstract

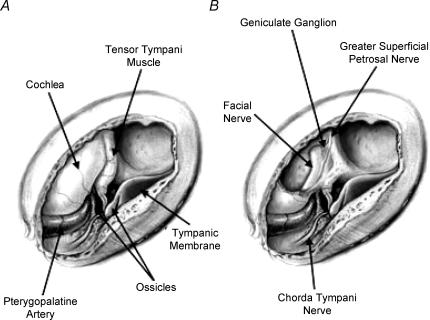
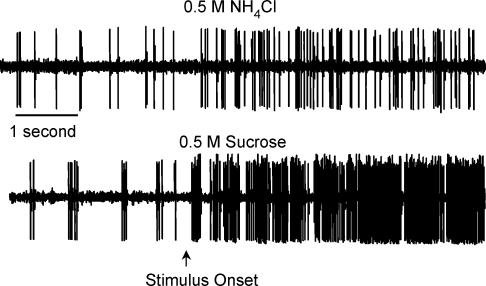
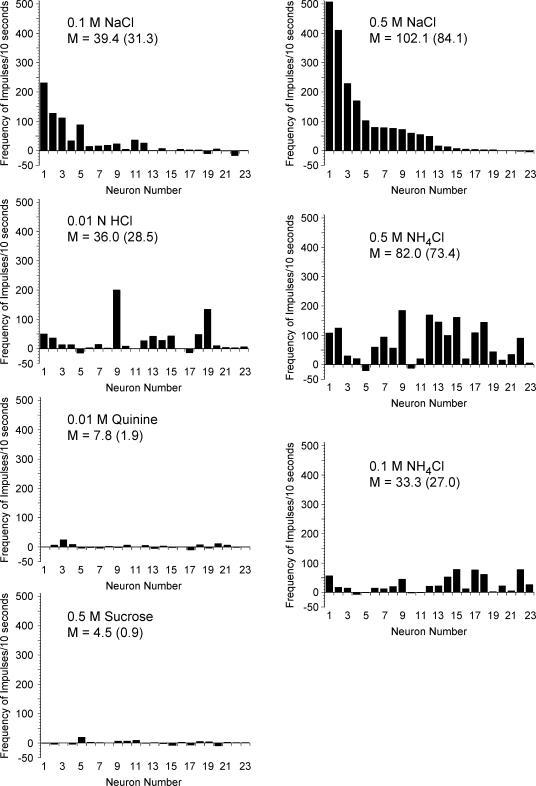
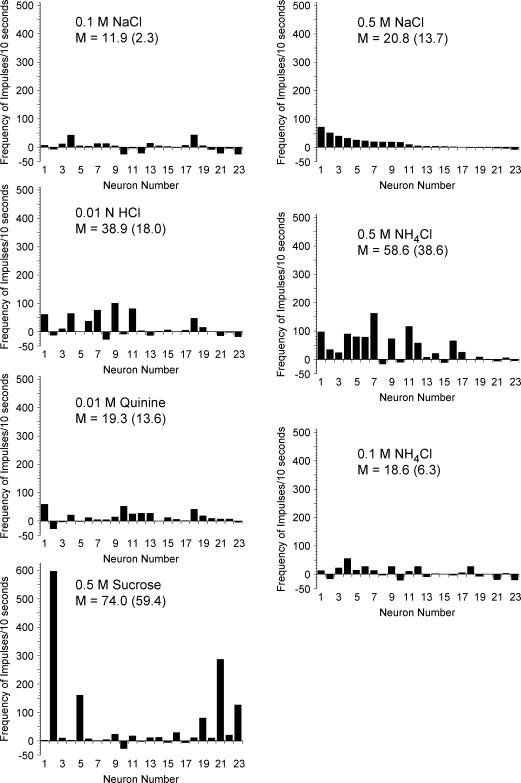
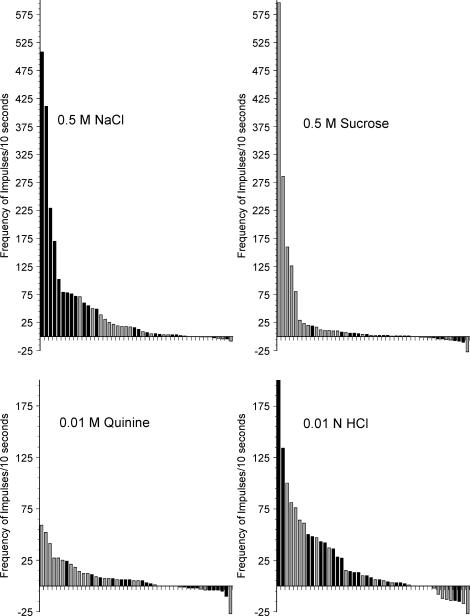
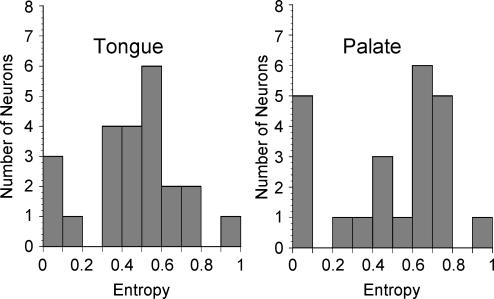
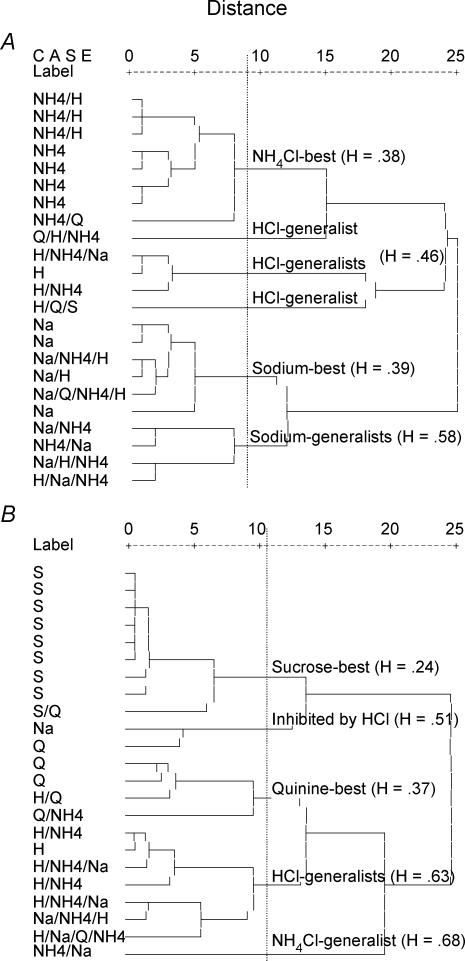
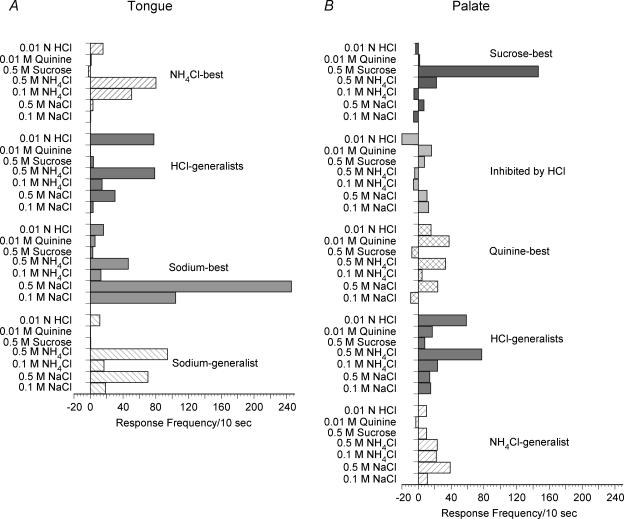
Coding of gustatory information is complex and unique among sensory systems; information is received by multiple receptor populations located throughout the oral cavity and carried to a single central relay by four separate nerves. The geniculate ganglion is the location of the somata of two of these nerves, the greater superficial petrosal (GSP) and the chorda tympani (CT). The GSP innervates taste buds on the palate and the CT innervates taste buds on the anterior tongue. To obtain requisite taste response profiles of GSP neurones, we recorded neurophysiological responses to taste stimuli of individual geniculate ganglion neurones in vivo in the rat and compared them to those from the CT. GSP neurones had a distinct pattern of responding compared to CT neurones. For example, a small subset of GSP neurones had high response frequencies to sucrose stimulation, whereas no CT neurones had high response frequencies to sucrose. In contrast, NaCl elicited high response frequencies in a small subset of CT neurones and elicited moderate response frequencies in a relatively large proportion of GSP neurones. The robust whole-nerve response to sucrose in the GSP may be attributable to relatively few, narrowly tuned neurones, whereas the response to NaCl in the GSP may relate to proportionately more, widely tuned neurones. These results demonstrate the diversity in the initial stages of sensory coding for two separate gustatory nerves involved in the ingestion or rejection of taste solutions, and may have implications for central coding of gustatory quality and concentration as well as coding of information used in controlling energy, fluid and electrolyte homeostasis.


Figures

Figure 1
Figure 1. Illustration of the surgical approach to the geniculate ganglion
A, a hole was cut in the ventral surface of the tympanic bulla, showing the ossicles and other internal structures within the bulla. B, the tensor tympani muscle and cochlea were removed to show the geniculate ganglion and greater superficial petrosal nerve. Illustrated by Anita Hylton.
Figure 2
Figure 2. Raw neurophysiological data of the response to 0.5 m NH4Cl and 0.5 m sucrose recorded from a geniculate ganglion neurone that innervated palatal taste receptors
Spontaneous activity precedes the stimulus onset.
Figure 3
Figure 3. Response frequencies above spontaneous activity for individual geniculate ganglion neurones that innervated taste receptors on the tongue
Each neurone was assigned a number based on its frequency of response to 0.5 m NaCl and ordered with the same neurone number for each stimulus. Therefore, the pattern of activity can be tracked for each individual neurone across all stimuli. The mean (M) of all frequencies greater than 0 is presented. The mean across all neurones is included in parentheses for comparison.
Figure 4
Figure 4. Response frequencies above baseline for individual geniculate ganglion neurones that innervated taste receptors on the palate
Each neurone was assigned a number based on its frequency of response to 0.5 m NaCl and ordered with the same neurone number for each stimulus. Therefore, the pattern of activity can be tracked for each individual neurone across all stimuli. Note that the y-axis value for sucrose is higher than the y-axis in other graphs. The mean (M) of all frequencies greater than 0 is presented. The mean across all neurones is included in parentheses for comparison.
Figure 5
Figure 5. Frequency of response (minus spontaneous activity) of individual neurones that innervated tongue taste receptors (black bars) or palatal taste receptors (grey bars)
Neurones are ordered within each stimulus based on the degree of response to that stimulus.
Figure 6
Figure 6. Histograms of entropy distributions for geniculate ganglion neurones responsive to tongue stimulation and those responsive to palatal stimulation
Entropy of ‘0’ indicates neurones that were highly responsive to a single stimulus or narrowly tuned. Entropy of ‘1’ indicates neurones that were broadly responsive across multiple stimuli. Analysis included responses to 0.1 m NaCl, 0.5 m sucrose, 0.01 m quinine and 0.01 n HCl.
Figure 7
Figure 7. Hierarchical cluster analysis based on individual neurone response from geniculate ganglion neurones that innervated the tongue (A) and those that innervated the palate (B)
Analyses included neural responses to 0.1 m NaCl, 0.1 m NH4Cl, 0.5 m sucrose, 0.01 m quinine and 0.01 n HCl. Each cell (left side of each graph) is labelled according to the stimuli that it responded to the best (Na = NaCl; NH4 = NH4Cl, Q = quinine; S = sucrose; H = HCl) followed by stimuli that were in the +High category (see Table 2) or were ≥ 50% of the response with the highest frequency. The vertical dashed line indicates the demarcation in groupings indicated by a scree analysis. ‘H’ indicates the entropy values of each cluster classification.
Figure 8
Figure 8. Mean responses to all seven stimuli recorded from geniculate ganglion neurones that innervated the tongue (A) or the palate (B)
Data are grouped according to the classifications generated from the cluster analyses that used five stimuli (0.1 m NaCl, 0.1 m NH4Cl, 0.5 m sucrose, 0.01 m quinine and 0.01 n HCl) to determine categories.

Similar articles

Cited by

References

    1. Beidler LM. Properties of chemoreceptors of tongue of rat. J Neurophysiol. 1953;16:595–607. - PubMed
    1. Boudreau JC, Hoang NK, Oravec J, Do LT. Rat neurophysiological taste responses to salt solutions. Chem Senses. 1983;8:131–150.
    1. Boughter JD, Jr, Pumplin DW, Yu C, Christy RC, Smith DV. Differential expression of alpha-gustducin in taste bud populations of the rat and hamster. J Neurosci. 1997;17:2852–2858. - PMC - PubMed
    1. Bradley RM. Sensory receptors of the larynx. Am J Med. 2000;108:47S–50S. - PubMed
    1. Contreras RJ, Frank ME. Sodium deprivation alters neural responses to gustatory stimuli. J General Physiol. 1979;73:569–594. - PMC - PubMed

Publication types

LinkOut - more resources