

Physiological properties of rod photoreceptor electrical coupling in the tiger salamander retina
- PMID: 15746168
- PMCID: PMC1464472
- DOI: 10.1113/jphysiol.2005.082859
Physiological properties of rod photoreceptor electrical coupling in the tiger salamander retina
Abstract
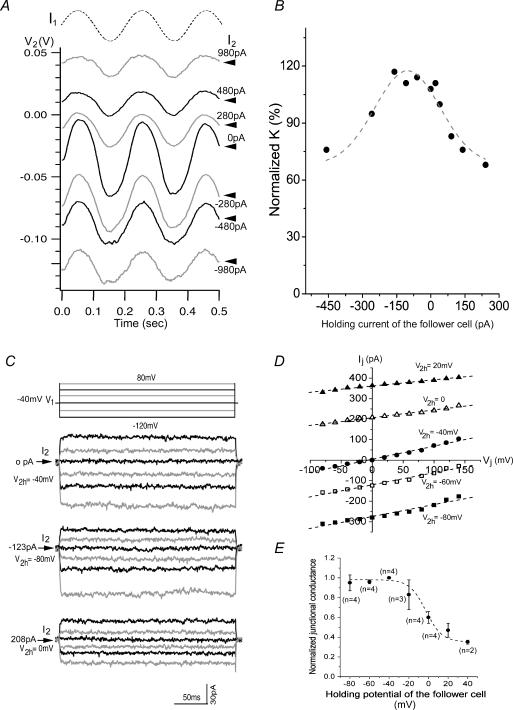
Using dual whole-cell voltage and current clamp recording techniques, we investigated the gap junctional conductance and the coupling coefficient between neighbouring rods in live salamander retinal slices. The application of sinusoidal stimuli over a wide range of temporal frequencies allowed us to characterize the band-pass filtering properties of the rod network. We found that the electrical coupling of all neighbouring rods exhibited reciprocal and symmetrical conductivities. On average, the junctional conductance between paired rods was 500 pS and the coupling coefficient (the ratio of voltage responses of the follower cell to those of the driver cell), or K-value, was 0.07. Our experimental results also demonstrated that the rod network behaved like a band-pass filter with a peak frequency of about 2-5 Hz. However, the gap junctions between adjacent rods exhibited linearity and voltage independency within the physiological range of rods. These gap junctions did not contribute to the filtering mechanisms of the rod network. Combined with the computational modelling, our data suggest that the filtering of higher frequency rod signals by the network is largely mediated by the passive resistive and capacitive (RC) properties of rod plasma membranes. Furthermore, we found several attributes of rod electrical coupling resembling the physiological properties of gene-encoded Cx35/36 gap junctions examined in other in vitro studies. This indicates that the previously found Cx35/36 expression in the salamander rod network may be functionally involved in rod-rod electrical coupling.
Figures


Similar articles
-
Connexin35/36 gap junction proteins are expressed in photoreceptors of the tiger salamander retina.J Comp Neurol. 2004 Feb 23;470(1):1-12. doi: 10.1002/cne.10967. J Comp Neurol. 2004. PMID: 14755521
-
Direct Evidence for Daily Plasticity of Electrical Coupling between Rod Photoreceptors in the Mammalian Retina.J Neurosci. 2016 Jan 6;36(1):178-84. doi: 10.1523/JNEUROSCI.3301-15.2016. J Neurosci. 2016. PMID: 26740659 Free PMC article.
-
Behaviour of the rod network in the tiger salamander retina mediated by membrane properties of individual rods.J Physiol. 1980 Dec;309:287-315. doi: 10.1113/jphysiol.1980.sp013509. J Physiol. 1980. PMID: 7252867 Free PMC article.
-
Electrical synapses between AII amacrine cells in the retina: Function and modulation.Brain Res. 2012 Dec 3;1487:160-72. doi: 10.1016/j.brainres.2012.05.060. Epub 2012 Jul 7. Brain Res. 2012. PMID: 22776293 Review.
-
Multiple neuronal connexins in the mammalian retina.Cell Commun Adhes. 2003 Jul-Dec;10(4-6):425-30. doi: 10.1080/cac.10.4-6.425.430. Cell Commun Adhes. 2003. PMID: 14681052 Review.
Cited by
-
Expression and Localization of Connexins in the Outer Retina of the Mouse.J Mol Neurosci. 2016 Feb;58(2):178-92. doi: 10.1007/s12031-015-0654-y. Epub 2015 Oct 9. J Mol Neurosci. 2016. PMID: 26453550
-
Low-conductance HCN1 ion channels augment the frequency response of rod and cone photoreceptors.J Neurosci. 2009 May 6;29(18):5841-53. doi: 10.1523/JNEUROSCI.5746-08.2009. J Neurosci. 2009. PMID: 19420251 Free PMC article.
-
Complementary conductance changes by IKx and Ih contribute to membrane impedance stability during the rod light response.Channels (Austin). 2009 Sep-Oct;3(5):301-7. doi: 10.4161/chan.3.5.9454. Epub 2009 Sep 7. Channels (Austin). 2009. PMID: 19713736 Free PMC article.
-
Quantal mEPSCs and residual glutamate: how horizontal cell responses are shaped at the photoreceptor ribbon synapse.Eur J Neurosci. 2008 May;27(10):2575-86. doi: 10.1111/j.1460-9568.2008.06226.x. Eur J Neurosci. 2008. PMID: 18547244 Free PMC article.
-
Photoreceptor coupling mediated by connexin36 in the primate retina.J Neurosci. 2012 Mar 28;32(13):4675-87. doi: 10.1523/JNEUROSCI.4749-11.2012. J Neurosci. 2012. PMID: 22457514 Free PMC article.
References
-
- Attwell D. The Sharpey-Schafer lecture. Ion channels and signal processing in the outer retina. Q J Exp Physiol. 1986;71:497–536. - PubMed
-
- Attwell D, Wilson M, Wu SM. The effect of light on the spread of signals through the rod network of the salamander retina. Brain Res. 1985;343:79–88. 10.1016/0006-8993(85)91160-6. - DOI - PubMed
MeSH terms
Substances
LinkOut - more resources
Full Text Sources
Miscellaneous