

Spontaneous formation of detergent micelles around the outer membrane protein OmpX
- PMID: 15749771
- PMCID: PMC1305469
- DOI: 10.1529/biophysj.105.060426
Spontaneous formation of detergent micelles around the outer membrane protein OmpX
Abstract
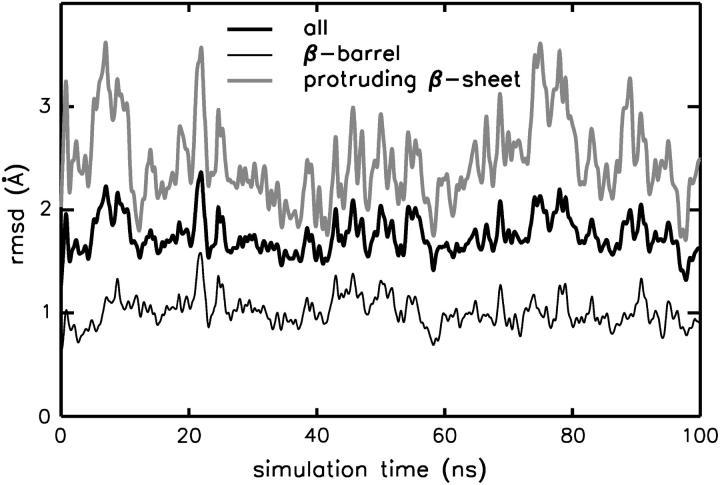
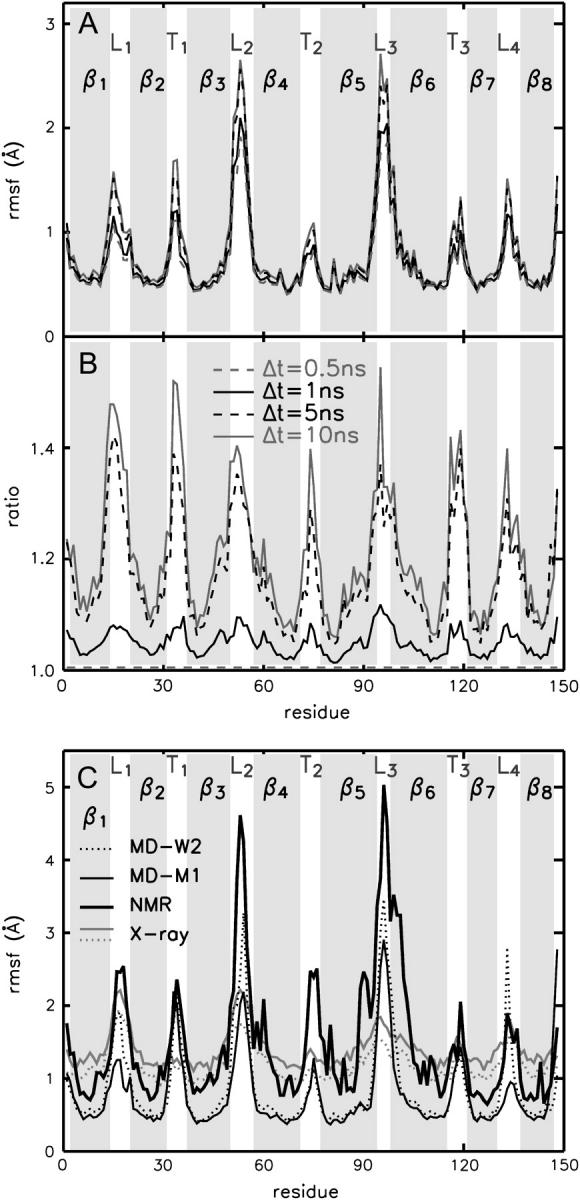
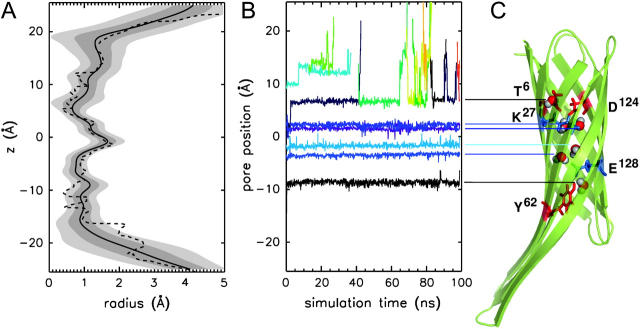
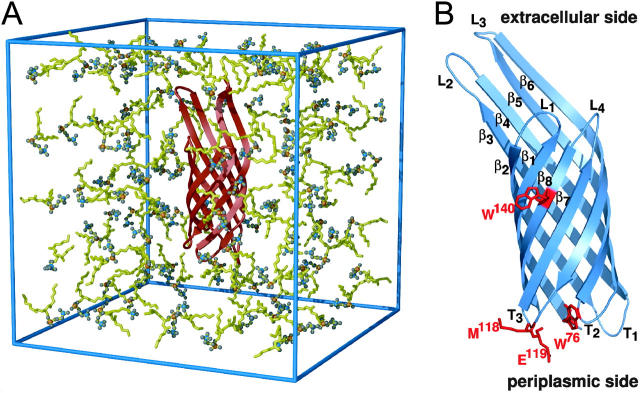
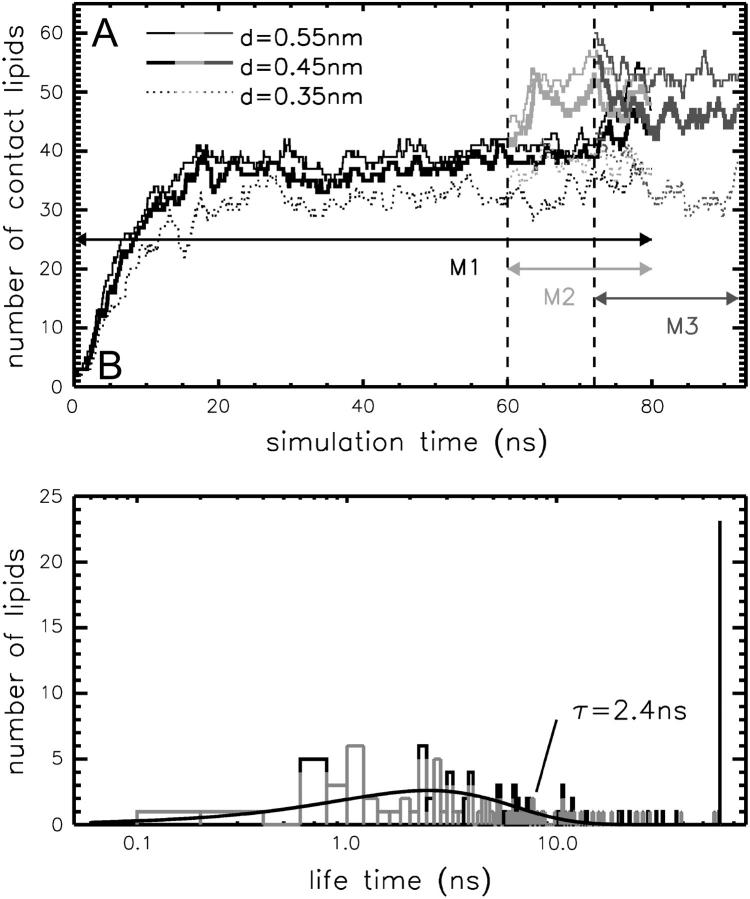
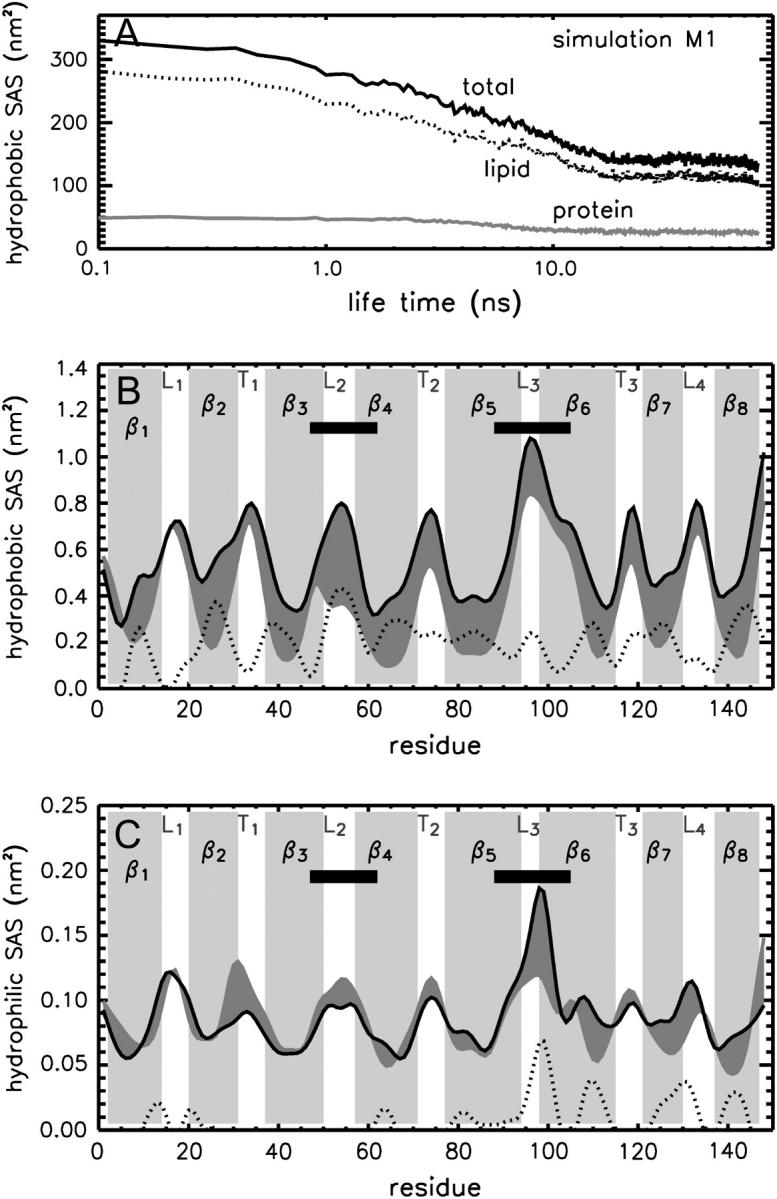
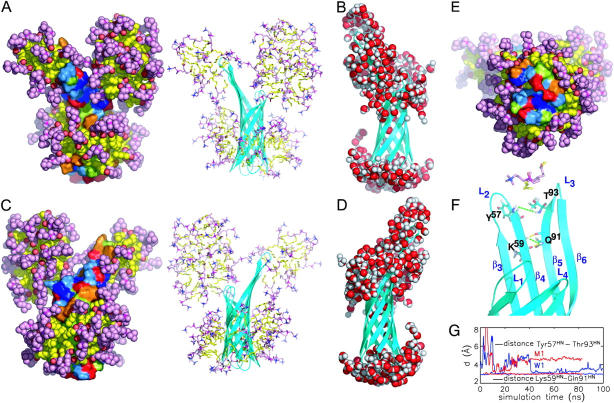
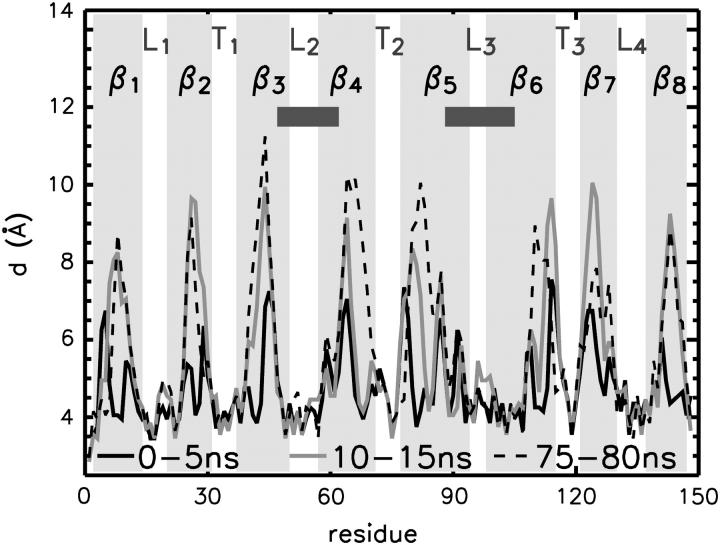
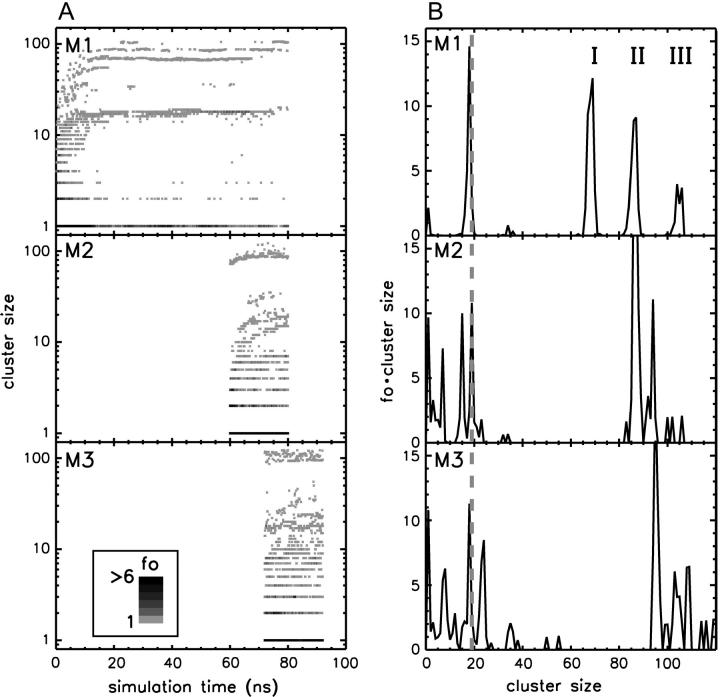
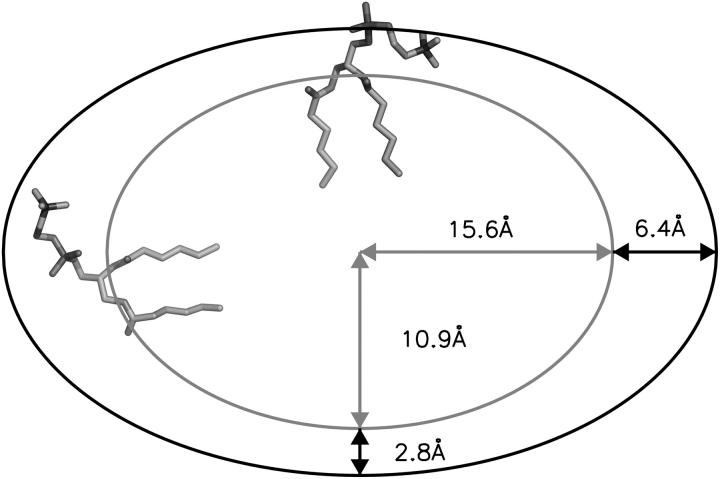
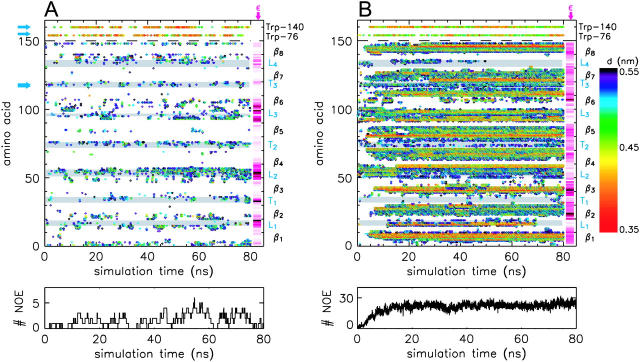
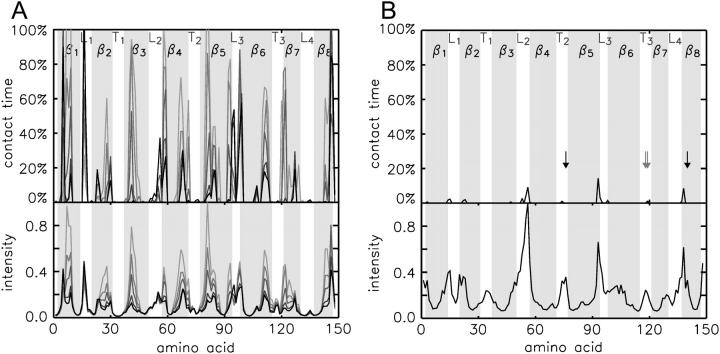
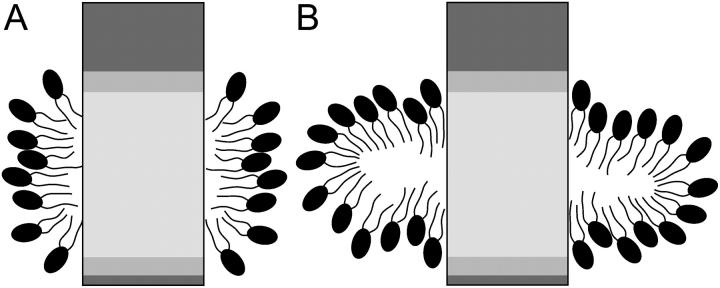
The structure and flexibility of the outer membrane protein X (OmpX) in a water-detergent solution and in pure water are investigated by molecular dynamics simulations on the 100-ns timescale and compared with NMR data. The simulations allow for an unbiased determination of the structure of detergent micelles and the protein-detergent mixed micelle. The short-chain lipid dihexanoylphosphatidylcholine, as a detergent, aggregates into pure micelles of approximately 18 molecules, or alternatively, it binds to the protein surface. The detergent binds in the form of a monolayer ring around the hydrophobic beta-barrel of OmpX rather than in a micellar-like oblate; approximately 40 dihexanoylphosphatidylcholine lipids are sufficient for an effective suppression of water from the surface of the beta-barrel region. The phospholipids bind also on the extracellular, protruding beta-sheet. Here, polar interactions between charged amino acids and phosphatidylcholine headgroups act as condensation seed for detergent micelle formation. The polar protein surface remains accessible to water molecules. In total, approximately 90-100 detergent molecules associate within the protein-detergent mixed micelle, in agreement with experimental estimates. The simulation results indicate that OmpX is not a water pore and support the proposed role of the protruding beta-sheet as a "fishing rod".
Figures
Similar articles
-
Lipid-protein interactions in DHPC micelles containing the integral membrane protein OmpX investigated by NMR spectroscopy.Proc Natl Acad Sci U S A. 2002 Oct 15;99(21):13533-7. doi: 10.1073/pnas.212515099. Epub 2002 Oct 7. Proc Natl Acad Sci U S A. 2002. PMID: 12370417 Free PMC article.
-
Membrane protein-lipid interactions in mixed micelles studied by NMR spectroscopy with the use of paramagnetic reagents.Chembiochem. 2004 Apr 2;5(4):467-73. doi: 10.1002/cbic.200300815. Chembiochem. 2004. PMID: 15185370
-
NMR solution structure determination of membrane proteins reconstituted in detergent micelles.FEBS Lett. 2003 Nov 27;555(1):144-50. doi: 10.1016/s0014-5793(03)01155-4. FEBS Lett. 2003. PMID: 14630335 Review.
-
Membrane protein dynamics in different environments: simulation study of the outer membrane protein X in a lipid bilayer and in a micelle.Eur Biophys J. 2011 Jan;40(1):39-58. doi: 10.1007/s00249-010-0626-7. Epub 2010 Oct 5. Eur Biophys J. 2011. PMID: 20922370
-
Solution NMR studies of the integral membrane proteins OmpX and OmpA from Escherichia coli.FEBS Lett. 2001 Aug 31;504(3):173-8. doi: 10.1016/s0014-5793(01)02742-9. FEBS Lett. 2001. PMID: 11532450 Review.
Cited by
-
Perturbations of Native Membrane Protein Structure in Alkyl Phosphocholine Detergents: A Critical Assessment of NMR and Biophysical Studies.Chem Rev. 2018 Apr 11;118(7):3559-3607. doi: 10.1021/acs.chemrev.7b00570. Epub 2018 Feb 28. Chem Rev. 2018. PMID: 29488756 Free PMC article. Review.
-
Outer membrane proteins: comparing X-ray and NMR structures by MD simulations in lipid bilayers.Eur Biophys J. 2008 Feb;37(2):131-41. doi: 10.1007/s00249-007-0185-8. Epub 2007 Jun 6. Eur Biophys J. 2008. PMID: 17551722
-
Solution NMR mapping of water-accessible residues in the transmembrane beta-barrel of OmpX.Eur Biophys J. 2010 Mar;39(4):623-30. doi: 10.1007/s00249-009-0513-2. Epub 2009 Jul 29. Eur Biophys J. 2010. PMID: 19639312
-
Contribution of charged and polar residues for the formation of the E1-E2 heterodimer from Hepatitis C Virus.J Mol Model. 2010 Oct;16(10):1625-37. doi: 10.1007/s00894-010-0672-1. Epub 2010 Mar 2. J Mol Model. 2010. PMID: 20195665
-
Interactions of lipids and detergents with a viral ion channel protein: molecular dynamics simulation studies.J Phys Chem B. 2015 Jan 22;119(3):764-72. doi: 10.1021/jp505127y. Epub 2014 Oct 21. J Phys Chem B. 2015. PMID: 25286030 Free PMC article.
References
-
- Arora, A., F. Abildgaard, J. H. Bushweller, and L. K. Tamm. 2001. Structure of outer membrane protein A transmembrane domain by NMR spectroscopy. Nat. Struct. Biol. 8:334–338. - PubMed
-
- Arora, A., and L. K. Tamm. 2001. Biophysical approaches to membrane protein structure determination. Curr. Opin. Struct. Biol. 11:540–547. - PubMed
-
- Ash, W. L., M. R. Zlomislic, E. O. Oloo, and D. P. Tieleman. 2004. Computer simulations of membrane proteins. Biochim. Biophys. Acta. 1666:158–189. - PubMed
-
- Berendsen, H. J. C., J. P. M. Postma, W. F. van Gunsteren, A. D. Nola, and J. R. Haak. 1984. Molecular dynamics with coupling to an external bath. J. Chem. Phys. 81:3684–3690.
Publication types
MeSH terms
Substances
LinkOut - more resources
Full Text Sources
Other Literature Sources
Miscellaneous
