. 2005 Mar 15;102(11):4164-9.
doi: 10.1073/pnas.0407698102. Epub 2005 Mar 4.

Lipofuscin accumulation, abnormal electrophysiology, and photoreceptor degeneration in mutant ELOVL4 transgenic mice: a model for macular degeneration

Affiliations

Lipofuscin accumulation, abnormal electrophysiology, and photoreceptor degeneration in mutant ELOVL4 transgenic mice: a model for macular degeneration

G Karan et al. Proc Natl Acad Sci U S A. .

Abstract

Macular degeneration is a heterogeneous group of disorders characterized by photoreceptor degeneration and atrophy of the retinal pigment epithelium (RPE) in the central retina. An autosomal dominant form of Stargardt macular degeneration (STGD) is caused by mutations in ELOVL4, which is predicted to encode an enzyme involved in the elongation of long-chain fatty acids. We generated transgenic mice expressing a mutant form of human ELOVL4 that causes STGD. In these mice, we show that accumulation by the RPE of undigested phagosomes and lipofuscin, including the fluorophore, 2-[2,6-dimethyl-8-(2,6,6-trimethyl-1-cyclohexen-1-yl)-1E,3E,5E,7E-octatetraenyl]-1-(2-hyydroxyethyl)-4-[4-methyl-6-(2,6,6,-trimethyl-1-cyclohexen-1-yl)-1E,3E,5E-hexatrienyl]-pyridinium (A2E) is followed by RPE atrophy. Subsequently, photoreceptor degeneration occurs in the central retina in a pattern closely resembling that of human STGD and age-related macular degeneration. The ELOVL4 transgenic mice thus provide a good model for both STGD and dry age-related macular degeneration, and represent a valuable tool for studies on therapeutic intervention in these forms of blindness.


Figures

Fig. 1.
Fig. 1.
Transgene constructs and expression. (A) IRBP promoter directs WT and mutant ELOVL4 cDNA expression. (B) WT and mutant ELOVL4 expression compared with endogenous mouse Elovl4 expression, as determined by measuring mRNA levels (mean ± SEM) from six separate experiments of semiquantitative PCR (example of gel is shown in Fig. 5). In each experiment, endogenous mouse Elovl4 was normalized to 1.0.
Fig. 2.
Fig. 2.
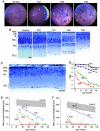
Characterization of photoreceptor degeneration in ELOVL4 mutant mice. (A) Fundus photographs from representative mice at ≈1.5 years of age. Abnormalities in fundus appearance were more evident with higher levels of mutant ELOVL4 expression (TG3 > TG2 > TG1). They included depigmented subretinal spots (small yellow arrows) and geographical atrophy (large black arrows). (B) Light microscopy of retinas of WT and transgenic mice. The control retina from a 1-year-old mouse is normal. The retina from a 1-year-old TG1 mouse has lost approximately two layers of photoreceptor cell nuclei. The retina from a 12-week-old TG2 mouse has shortened outer and inner segments and a moderately reduced outer nuclear layer (ONL). The retina from a 12-week-old TG3 mouse has lost a large number of photoreceptor cells, and has perturbed photoreceptor inner and outer segment layers. RPE, retinal pigmented epithelium; OS, photoreceptor outer segments; IS, photoreceptor inner segments; ONL, outer nuclear layer; INL, inner nuclear layer; GCL, ganglion cell layer. (Scale bar, 20 μm.) (C) Lower magnification light microscopy of a 6-month-old TG3 retina, showing peripheral (Left) to central (Right) progression in RPE degeneration. Arrow indicates the margin of complete RPE atrophy. Abbreviations are as in B. (Scale bar, 40 μm.) (D) Time course of the progressive loss of photoreceptors in mutant ELOVL4 transgenic mice up to 36 weeks of age. Photoreceptor cell nuclei were counted from the regions that are 200–300 μm dorsal and ventral from the optic nerve head. Retinas from six mice were counted for each mouse line at each age shown. Error bars (which, in most cases, are too small to be evident) represent ± SEM. The rate of photoreceptor cell loss was greater with higher levels of mutant ELOVL4 expression. (E) Progressive loss of the maximal b-wave response of ERG recordings in mutant ELOVL4 transgenic mice over time. The response declined in all transgenic lines, but was greater with higher levels of mutant ELOVL4 expression. Mice expressing WT ELOVL4 (WT1) were indistinguishable from WT mice (90% of WT lie within gray area). (F) Progressive loss of the maximal a-wave response of ERG recordings in mutant ELOVL4 transgenic mice over time. The response declined in all transgenic lines, but was greater with higher levels of mutant ELOVL4 expression. Mice expressing WT ELOVL4 (WT1) were indistinguishable from WT mice (90% of WT lie within gray area)
Fig. 3.
Fig. 3.
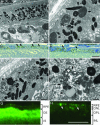
Ultrastructure of pathology. (A) Photoreceptor outer segments from a 2-month-old TG3 retina, showing disorganized disk membranes. The RPE appears relatively normal. (BF) Micrographs from 7-month-old TG2 mouse retinas. Arrows indicate phagosomes containing undigested ROS disk membranes (B), bodies in the RPE that correspond to accumulations of lipofuscin material (C and D), more clearly defined by electron microscopy (E and F). In the higher magnification EM image (F), the lipofuscin accumulation is shown to contain undigested membranes, amorphous material, and lipid droplets (lowest arrow indicates a large lipid droplet). (Scale bars, 2 μm in A; 1 μm in B and E; 10 μm in C and D; and 300 nm in F.) (G and H) Lipofuscin accumulation in the RPE cells, as shown by autofluorescence. Cryosections of 10-month-old normal littermate control (G) and TG2 (H) retinas. Several bright dots and clusters of lipofuscin (e.g., arrows) are evident in the RPE cells of the TG2 transgenic mouse, using the FITC filter, whereas only few small dots are present in the normal retina (from a littermate control). Autofluorescence of the photoreceptor outer segments is evident in the control retina. Only a few photoreceptor cells with very short outer segments remain in the transgenic mouse. (Scale bar, 50 μm.)
Fig. 4.
Fig. 4.
Analysis and quantification of A2E in the RPE of TG2 and littermate control mice. (A)(Upper) UV-visible spectra of A2E, with λmax of 442, 335 (red), oxy-A2E, with λmax of 423, 307 (blue), and iso-A2E, with λmax of 427, 335 (green). (Lower) HPLC chromatogram of 2-month-old TG2/littermate RPE extracts (red, littermate; black, TG2). Peaks of interest are labeled as ATR (all-trans retinal), oxy-A2E (oxygenated A2E), an uncharacterized bis-retinoid, A2E (all-trans), A2E isomers (additional isomers of A2E), iso-A2E (13-cis). ATR was presumably resulted from residual photoreceptor outer segments during eyecup preparation. (B) Quantification of A2E and isomers in TG2 mouse eyecups: all-trans-A2E, 72.45 pmol per eye ± 7.9; iso-A2E, 45.7 pmol per eye ± 2.1; and remaining A2E isomers, 0.65 nmol per eye ± 0.04. No detectable amount of A2E was found in littermate RPE samples.

References

    1. Bressler, N. M., Bressler, S. B. & Fine, S. L. (1988) Surv. Ophthalmol. 32, 375–413. - PubMed
    1. Friedman, D. S., O'Colmain, B. J., Munoz, B., Tomany, S. C., McCarty, C., de Jong, P. T., Nemesure, B., Mitchell, P. & Kempen, J. (2004) Arch. Ophthalmol. 122, 564–572. - PubMed
    1. Zhang, K., Kniazeva, M., Han, M., Li, W., Yu, Z., Yang, Z., Li, Y., Metzker, M. L., Allikmets, R., Zack, D. J., et al. (2001) Nat. Genet. 27, 89–93. - PubMed
    1. Edwards, A. O., Donoso, L. A. & Ritter, R., III (2001) Invest. Ophthalmol. Vis. Sci. 42, 2652–2663. - PubMed
    1. Zhang, X. M., Yang, Z., Karan, G., Hashimoto, T., Baehr, W., Yang, X. J. & Zhang, K. (2003) Mol. Vis. 9, 301–307. - PMC - PubMed

Publication types