

Changes in upper airway size during tidal breathing in children with obstructive sleep apnea syndrome
- PMID: 15750038
- PMCID: PMC2718463
- DOI: 10.1164/rccm.200411-1597OC
Changes in upper airway size during tidal breathing in children with obstructive sleep apnea syndrome
Abstract
We performed respiratory-gated magnetic resonance imaging to evaluate airway dynamics during tidal breathing in 10 children with obstructive sleep apnea syndrome (OSAS; age, 4.3 +/- 2.3 years) and 10 matched control subjects (age, 5.0 +/- 2.0 years). We hypothesized that respiratory cycle fluctuations in upper airway cross-sectional area would be larger in children with OSAS.
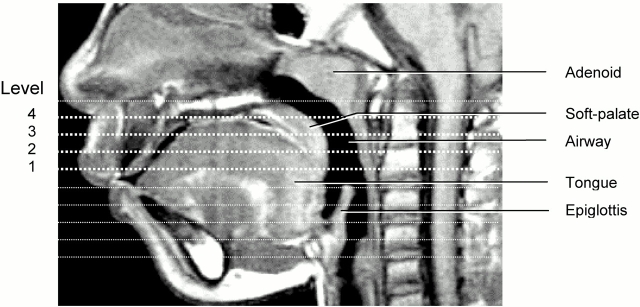
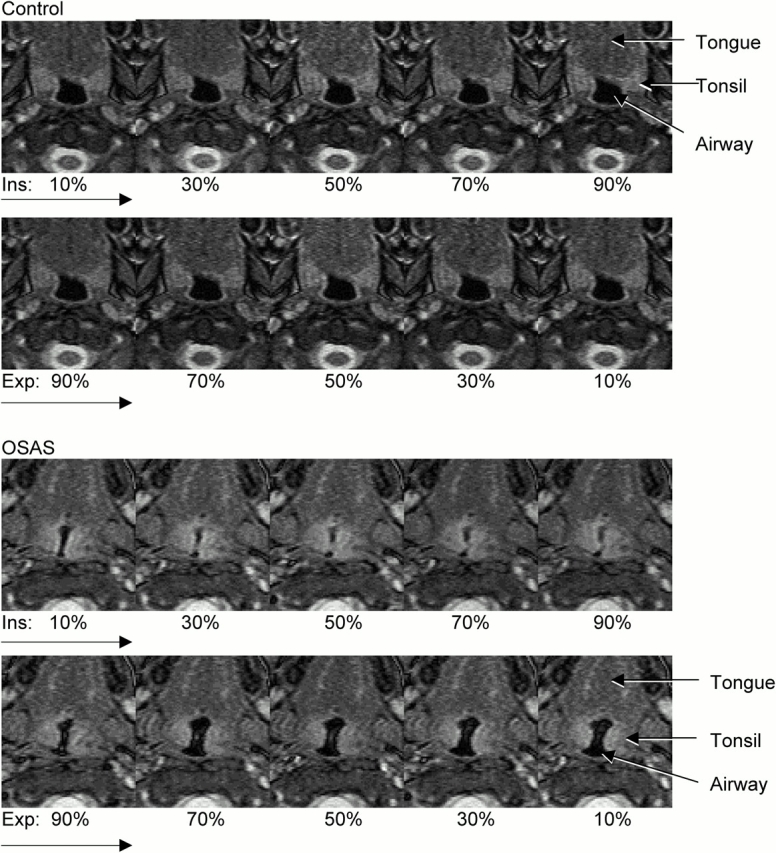
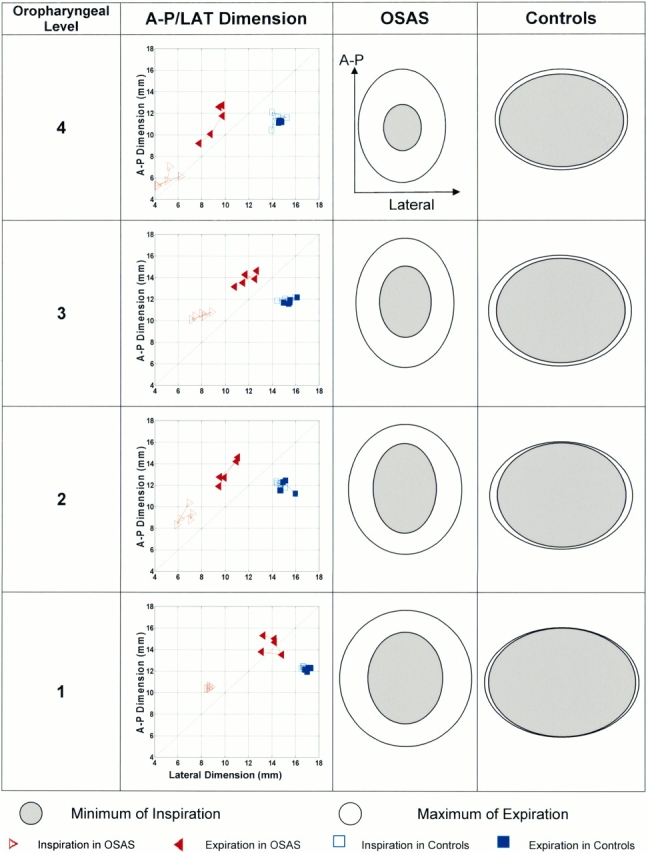
Methods: Studies were performed under sedation. Respiratory gating was performed automatically at 10, 30, 50, 70, and 90% of inspiratory and expiratory volume. Airway cross-sectional area was measured at four ascending oropharyngeal levels at each increment of the respiratory cycle.
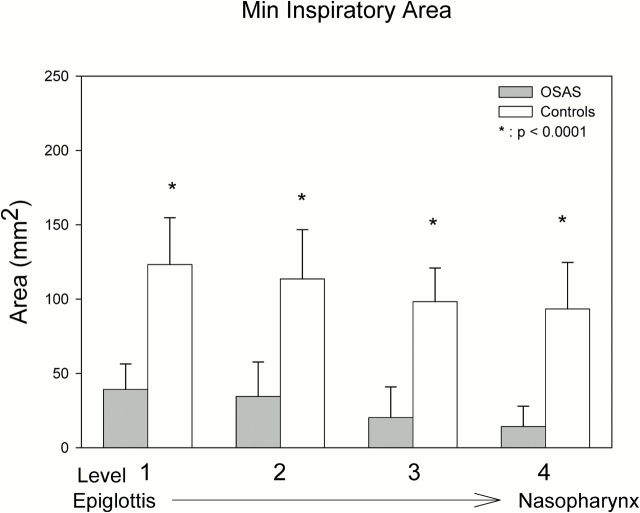
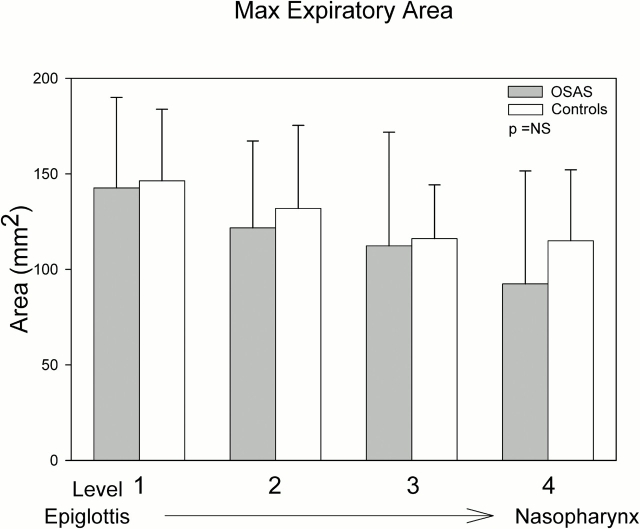
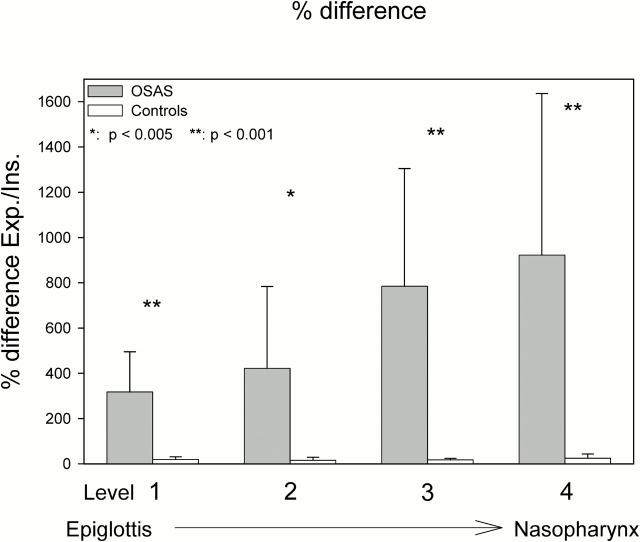
Results: We noted the following in subjects with OSAS compared with control subjects: (1) a smaller upper airway cross-sectional area, particularly during inspiration; (2) airway narrowing occurred during inspiration without evidence of complete airway collapse; (3) airway dilatation occurred during expiration, particularly early in the phase; and (4) magnitude of cross-sectional areas fluctuations during tidal breathing noted in OSAS at levels 1 through 4 were 317, 422, 785, and 922%, compared with 19, 15 17, and 24% in control subjects (p < 0.001, p < 0.005, p < 0.001, and p < 0.001, respectively).
Conclusions: Fluctuations in airway area during tidal breathing are significantly greater in subjects with OSAS compared with control subjects. Resistive pressure loading is a probable explanation, although increased airway compliance may be a contributing factor.
Figures

References
-
- Redline S, Tishler PV, Schluchter M, Aylor J, Clark K, Graham G. Risk factors for sleep-disordered breathing in children: associations with obesity, race, and respiratory problems. Am J Respir Crit Care Med 1999;159:1527–1532. - PubMed
-
- Arens R, Marcus CL. Pathophysiology of upper airway obstruction: a developmental perspective. Sleep 2004;27:997–1019. - PubMed
-
- Marcus CL, McColley SA, Carroll JL, Loughlin GM, Smith PL, Schwartz AR. Upper airway collapsibility in children with obstructive sleep apnea syndrome. J Appl Physiol 1994;77:918–924. - PubMed
-
- Gozal D, Burnside MM. Increased upper airway collapsibility in children with obstructive sleep apnea during wakefulness. Am J Respir Crit Care Med 2004;169:163–167. - PubMed
Publication types
MeSH terms
Grants and funding
LinkOut - more resources
Full Text Sources
Molecular Biology Databases
